Validation of the Geothermal Borehole Calculation in nPro
This page validates the calculation of geothermal borehole fields in nPro. The results from nPro are compared with the software EED (Earth Energy Designer), with GEO-HANDlight by Prof. Koenigsdorff, with a scientific comparison study of 12 software tools, and with the reference values of VDI 4640 Part 2.
The calculation methodology used in nPro (fundamentals, determination of borehole length, calculation of the heat pump outlet temperature, and validated value ranges of the input parameters) is described on the page Design of Geothermal Boreholes: Calculation Methodology.
Validation with EED (Earth Energy Designer)
Below, the sizing of geothermal boreholes in nPro is compared with the calculation results from EED (Earth Energy Designer) using two example calculations. EED is a standard software for geothermal design. By default, nPro calculates the g-function using the boundary condition of a uniform borehole wall temperature (UBWT).
Table 1: Fixed input values that do not change in the following validation scenarios (unless stated otherwise).
Ground thermal conductivity
Ground volumetric heat capacity
Geothermal heat flux
Borehole thermal resistance
Borehole radius
Air temperature
Design period
2.2 W/(mK)
2.12 MJ/(m³K)
0.064 W/m²
0.08 mK/W
0.081 m
11.2 °C
50 years
Table 2: Load cases for the validation scenarios: The regeneration ratio describes the ratio of heat injected into the ground to heat extracted.
Load case
Annual heat demand
Max. monthly heat demand
Peak heat load
Regeneration ratio
1
351 MWh/a
57.94 MWh/month
189 kW
28.5 %
2
287.1 MWh/a
47.4 MWh/month
155 kW
28.6 %
Table 3: Borehole length depending on the borehole configuration, borehole spacing (8.65 m and 8 m in load cases 1 and 2), minimum borehole inlet temperature (-1 °C), and temperature difference between borehole inlet and outlet (3 and 3.6 K).
Load case
Borehole configuration
nPro
EED
Deviation
1
5 x 10 (50 boreholes)
138 m
140 m
-1.4 %
2
2 x 17 (34 boreholes)
148 m
140 m
5.7 %
The deviations between the calculation results of nPro and EED are small. In the first load case, the borehole length differs by 2 m (138 m in nPro vs. 140 m in EED); in the second load case, by 8 m (148 m in nPro vs. 140 m in EED). The relative deviations are 1.4 % in the first load case and 5.7 % in the second load case. The deviations result, among other things, from the different methods used to calculate the g-function. In nPro, the g-function is calculated geometrically using the pygfunction computational core by Massimo Cimmino. Overall, however, the deviations between the two software tools are acceptable (approx. 5 - 10 %), especially considering that the uncertainty of the input parameters in the early planning phase of a geothermal system is considerably larger.
Validation with GEO-HANDlight
In addition to the validation with EED, the nPro calculation methodology was compared with GEO-HANDlight (version 5.0) by Prof. Koenigsdorff. In this validation, the g-function was calculated using the boundary condition of a uniform heat transfer rate (UHTR). The current version of nPro, by contrast, uses the boundary condition of a uniform borehole wall temperature (UBWT) by default. This leads to slight deviations in the calculation of the g-function.
Validation of the Borehole Length Calculation Methodology
Below, the sizing of geothermal boreholes in nPro is compared with the calculation results from the GEO-HANDlight tool (version 5.0) by Prof. Koenigsdorff.
Definition of the Validation Scenarios
Table 4: Load cases for the validation scenarios: The regeneration ratio describes the ratio of heat injected into the ground to heat extracted.
Load case
Annual heat demand
Max. monthly heat demand
Peak heat load
Regeneration ratio
1
48.74 MWh/a
12.76 MWh/month
41.23 kW
0 %
2
64.66 MWh/a
9.26 MWh/month
54.98 kW
14.3 %
3
36.36 MWh/a
13.18 MWh/month
49.82 kW
100 %
Table 5: Fixed input values that do not change in the following validation scenarios (unless stated otherwise).
Borehole thermal resistance
Borehole radius
Geothermal heat flux
Temperature difference borehole inlet/outlet
Location / air temperature
0.1 mK/W
0.075 m
0.065 W/m²
4 K
Berlin / 10.24 °C
Validation of the Borehole Length Calculation
The borehole lengths calculated with nPro and GEO-HANDlight are compared for various rectangular borehole configurations. The deviation results from the different methods used to determine the g-function (nPro calculates the g-function geometrically using the computational core by Massimo Cimmino, while GEO-HANDlight uses heuristic calculation approaches). Overall, however, the deviations between the two tools are small (below 3 % in most cases).
Table 6: Borehole length depending on the borehole configuration: The calculation assumes the second load case and a heat pump outlet temperature of -5 °C. The boreholes are spaced 10 m apart and the ground has a thermal conductivity of 1.5 W/(mK).
Borehole configuration
nPro
GEO-HANDlight
Deviation
3x2
226 m
229 m
-1.3 %
3x3
172 m
186 m
-7.5 %
6x2
136 m
139 m
-2.2 %
4x4
112 m
111 m
0.9 %
6x3
99 m
100 m
-1 %
Table 7: Borehole length depending on the heat pump outlet temperature: The calculation examines the second load case. The boreholes are arranged in a 4x4 configuration with a spacing of 10 m. The ground has a thermal conductivity of 1.5 W/(mK).
Heat pump outlet temperature
nPro
GEO-HANDlight
Deviation
-5 °C
111 m
111 m
0 %
-3 °C
129 m
130 m
-0.8 %
0 °C
164 m
170 m
-3.5 %
Table 8: Borehole length depending on the borehole spacing: The calculation examines the second load case and a heat pump outlet temperature of 0 °C. The boreholes are arranged in a 4x4 configuration. The ground has a thermal conductivity of 1.5 W/(mK).
Borehole spacing
nPro
GEO-HANDlight
Deviation
10 m
164 m
170 m
-3.5 %
15 m
147 m
148 m
-0.7 %
20 m
137 m
136 m
0.7 %
30 m
124 m
127 m
-2.4 %
50 m
114 m
119 m
-4.2 %
Table 9: Borehole length depending on the borehole thermal resistance, borehole radius, and thermal conductivity: The calculation examines the second load case and a heat pump outlet temperature of 0 °C. The boreholes are arranged in a 4x4 configuration with a spacing of 10 m.
Borehole thermal resistance
Borehole radius
Thermal conductivity
nPro
GEO-HANDlight
Deviation
0.08 mK/W
0.075 m
1.5 W/(mK)
158 m
163 m
-3.1 %
0.1 mK/W
0.075 m
1.5 W/(mK)
164 m
170 m
-3.5 %
0.12 mK/W
0.075 m
1.5 W/(mK)
169 m
176 m
-4 %
0.1 mK/W
0.025 m
1.5 W/(mK)
193 m
199 m
-3 %
0.1 mK/W
0.05 m
1.5 W/(mK)
175 m
181 m
-3.3 %
0.1 mK/W
0.1 m
1.5 W/(mK)
155 m
162 m
-4.3 %
0.1 mK/W
0.075 m
2 W/(mK)
144 m
146 m
-1.4 %
0.1 mK/W
0.075 m
2.5 W/(mK)
129 m
129 m
0 %
0.1 mK/W
0.075 m
3 W/(mK)
117 m
117 m
0 %
Table 10: Borehole length depending on regeneration: For the calculation, the boreholes are arranged in a 4x4 configuration with a spacing of 10 m. The ground has a thermal conductivity of 1.5 W/(mK).
Annual heat extraction
Regeneration
nPro
GEO-HANDlight
Deviation
48.74 MWh/a
0 %
133 m
134 m
-0.7 %
64.66 MWh/a
14.3 %
164 m
170 m
-3.5 %
36.36 MWh/a
100 %
85 m
86 m
-1.2 %
Table 11: Borehole length depending on the location: The location affects the mean air temperature. The calculation examines the second load case and a heat pump outlet temperature of 0 °C. The boreholes are arranged in a 4x4 configuration with a spacing of 10 m. The ground has a thermal conductivity of 1.5 W/(mK).
Location
Mean air temperature
nPro
GEO-HANDlight
Deviation
Munich
9.53 °C
173 m
181 m
-4.4 %
Berlin
10.24 °C
164 m
170 m
-3.5 %
Frankfurt
11.24 °C
151 m
155 m
-2.6 %
Validation of the Heat Pump Outlet Temperature Calculation
To calculate the number of boreholes, nPro uses the heat pump outlet temperature as the design criterion. The heat pump outlet temperatures from nPro and the GEO-HANDlight tool are therefore compared below. A validation of the number of boreholes is not possible, as it cannot be determined directly with the GEO-HANDlight tool.
Table 12: Fixed input values that do not change in the following validation scenarios (unless stated otherwise).
Borehole thermal resistance
Borehole radius
Geothermal heat flux
Temperature difference borehole inlet/outlet
Location / air temperature
0.1 mK/W
0.075 m
0.065 W/m²
4 K
Berlin / 10.24 °C
Table 13: Heat pump outlet temperature depending on the borehole configuration: The calculation examines the second load case and a borehole length of 200 m. The boreholes are spaced 10 m apart and the ground has a thermal conductivity of 2.5 W/(mK).
Borehole configuration
nPro
GEO-HANDlight
Deviation
3x2
-5.2 °C
-5.5 °C
0.3 K
3x3
-5.9 °C
-5.9 °C
0 K
6x2
-1.8 °C
-1.7 °C
-0.1 K
4x4
0.4 °C
0.7 °C
-0.3 K
6x3
1.6 °C
2 °C
-0.4 K
Table 14: Heat pump outlet temperature depending on the borehole length: The calculation considers the second load case. The boreholes are arranged in a 6x3 configuration with a spacing of 10 m. The ground has a thermal conductivity of 2.5 W/(mK).
Borehole length
nPro
GEO-HANDlight
Deviation
200 m
4.6 °C
4.5 °C
0.1 K
100 m
-1.4 °C
-1.1 °C
-0.3 K
66.67 m
-5.7 °C
-5.5 °C
-0.2 K
Table 15: Heat pump outlet temperature depending on the borehole spacing: The calculation considers the second load case with a borehole length of 200 m. The boreholes are arranged in a 6x3 configuration with a spacing of 10 m. The ground has a thermal conductivity of 2.5 W/(mK).
Borehole spacing
nPro
GEO-HANDlight
Deviation
10 m
-1.4 °C
-0.4 °C
-0.3 K
15 m
-0.4 °C
-0.3 °C
-0.1 K
20 m
0.2 °C
0.2 °C
0 K
30 m
0.8 °C
0.7 °C
0.1 K
50 m
1.4 °C
1.1 °C
0.3 K
Table 16: Heat pump outlet temperature depending on the borehole thermal resistance, borehole radius, and thermal conductivity: The calculation examines the second load case and a borehole length of 200 m. The boreholes are arranged in a 4x4 configuration with a spacing of 10 m.
Borehole thermal resistance
Borehole radius
Thermal conductivity
nPro
GEO-HANDlight
Deviation
0.08 mK/W
0.075 m
2.5 W/(mK)
4.6 °C
4.8 °C
-0.2 K
0.1 mK/W
0.075 m
2.5 W/(mK)
4.3 °C
4.5 °C
-0.2 K
0.12 mK/W
0.075 m
2.5 W/(mK)
4.0 °C
4.2 °C
-0.2 K
0.1 mK/W
0.025 m
2.5 W/(mK)
3.2 °C
3.4 °C
-0.2 K
0.1 mK/W
0.05 m
2.5 W/(mK)
3.9 °C
4.1 °C
-0.2 K
0.1 mK/W
0.1 m
2.5 W/(mK)
4.3 °C
4.7 °C
-0.4 K
0.1 mK/W
0.075 m
2.5 W/(mK)
4.3 °C
4.5 °C
-0.2 K
0.1 mK/W
0.075 m
3 W/(mK)
4.6 °C
4.8 °C
-0.2 K
0.1 mK/W
0.075 m
3.5 W/(mK)
4.9 °C
5 °C
-0.1 K
Table 17: Heat pump outlet temperature depending on regeneration: For the calculation, the boreholes are arranged in a 6x3 configuration with a spacing of 10 m. The boreholes have a length of 200 m and the ground has a thermal conductivity of 2.5 W/(mK).
Annual heat extraction
Regeneration
nPro
GEO-HANDlight
Deviation
48.74 MWh/a
0 %
1.3 °C
1.4 °C
-0.1 K
64.66 MWh/a
14.3 %
-1.8 °C
-1.7 °C
-0.1 K
36.36 MWh/a
100 %
7.8 °C
7.6 °C
0.2 K
Table 18: Heat pump outlet temperature depending on the location: The location affects the mean air temperature. The calculation examines the second load case and a borehole length of 200 m. The boreholes are arranged in a 6x3 configuration with a spacing of 10 m. The ground has a thermal conductivity of 2.5 W/(mK).
Location
Mean air temperature
nPro
GEO-HANDlight
Deviation
Munich
9.53 °C
3.6 °C
3.8 °C
-0.2 K
Berlin
10.24 °C
4.3 °C
4.5 °C
-0.2 K
Frankfurt
11.24 °C
5.3 °C
5.5 °C
-0.2 K
Validation with a Scientific Study
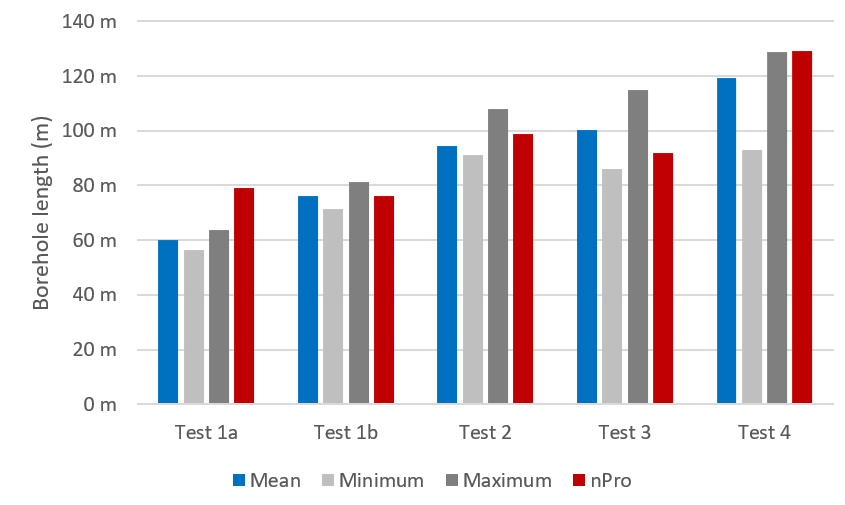
In addition to the validation with EED and GEO-HANDlight, the calculation results of nPro were compared with the results of a scientific study that quantitatively compared 12 software tools for geothermal borehole design (Ahmadfard et al.: A review of vertical ground heat exchanger sizing tools including an intermodel comparison, Renewable and Sustainable Energy Reviews, 2019)[4]. In this validation, the borehole length was calculated using the boundary condition of a temperature difference of 3 K between borehole inlet and borehole outlet. The table below shows the sizing of the geothermal boreholes using nPro and the other 12 software tools examined.
Table 19: Mean, minimum, and maximum of the calculation results of the 12 software tools examined compared with the calculation results of nPro for test cases 1a to 4 defined in the study.
Test 1a
Test 1b
Test 2
Test 3
Test 4
Mean
60 m
76 m
94 m
100 m
119 m
Minimum
57 m
71 m
91 m
86 m
93 m
Maximum
64 m
81 m
108 m
115 m
129 m
nPro
79 m
76 m
99 m
92 m
129 m
Figure 1: Graphical representation of the validation results: nPro compared with the software tools from the study.
Validation with VDI 4640 Part 2
In addition to the validation with EED, GEO-HANDlight, and a scientific comparison study, the calculation results of nPro were compared with selected reference values from the guideline VDI 4640 Part 2. Tables B2 to B4 of the guideline contain specific heat extraction rates for borehole heat exchangers in heating-only operation without domestic hot water heating. The reference values differ according to the thermal conductivity of the ground, the number of borehole heat exchangers, the annual full-load hours, and the minimum heat pump outlet temperature at peak load.
For the validation, six comparison cases were selected that cover various extreme and intermediate cases of the VDI tables. The borehole length was set to 100 m per borehole in all cases. The maximum extraction rate was calculated from the number of boreholes, the borehole length, and the specific extraction rate from the VDI table. The annual heat extraction results from the maximum extraction rate and the annual full-load hours.
The maximum extraction rate is calculated from the number of boreholes, the borehole length, and the specific extraction rate from the VDI table:
Q˙V=n⋅l⋅q˙
The annual heat extraction results from the maximum extraction rate and the annual full-load hours:
Qa=Q˙V⋅t
For all comparison cases, the boundary conditions specified in VDI 4640 Part 2 were adopted. These include double-U borehole heat exchangers with an effective borehole thermal resistance of 0.12 (mK)/W, a borehole radius of 0.075 m, a borehole spacing of 6 m, a temperature difference of 3 K, a mean undisturbed ground temperature of 11 °C, and a design period of 50 years. The volumetric heat capacity of the ground was set to 2.18 MJ/(m³K) in accordance with the calculation basis of GEO-HANDlight.
Table 20: Input values and results of the validation of selected extreme cases according to VDI 4640 Part 2, Tables B2 to B4.
Description
Min. inlet temp.
Full-load hours
Boreholes
Th. conductivity
Extraction VDI
Extraction nPro
Worst case
0 °C
2400 h/a
5
1 W/(mK)
10.7 W/m
10.6 W/m
Best table value
0 °C
1200 h/a
1
4 W/(mK)
44.3 W/m
44.0 W/m
Maximum number of boreholes at low full-load hours
0 °C
1200 h/a
5
1 W/(mK)
18.8 W/m
18.8 W/m
Single borehole at high full-load hours
0 °C
2400 h/a
1
4 W/(mK)
35.5 W/m
35.0 W/m
Low temperature limit
-5 °C
1800 h/a
1
2 W/(mK)
43.0 W/m
43.0 W/m
Intermediate multi-borehole case
-3 °C
2100 h/a
3
3 W/(mK)
36.9 W/m
37.0 W/m
The results show very good agreement between nPro and the specific extraction rates of VDI 4640 Part 2. The deviations for the selected comparison cases range between 0.0 % and 1.4 %. The largest relative deviation occurs in case D: nPro calculates 35.0 W/m compared with 35.5 W/m according to VDI 4640 Part 2.
The results thus confirm that nPro delivers consistent results compared with the reference values of VDI 4640 Part 2 for various combinations of number of boreholes, ground thermal conductivity, annual full-load hours, and temperature limits.