

The following validation comparing the two simulation tools energyPRO and nPro was conducted by the engineering company sinnogy GmbH based on a real-life application case. We thank sinnogy for providing the results.
Methodology of the tool comparison
The two software tools differ in the modeling of operational behavior:
- In energyPRO, the real operational behavior of the generation plants can be modeled in detail (minimum power, start-up and shutdown ramps, minimum operating duration, maximum operating duration).
- In nPro, the operational behavior is simplified and represented as an ideally modulating generation unit.
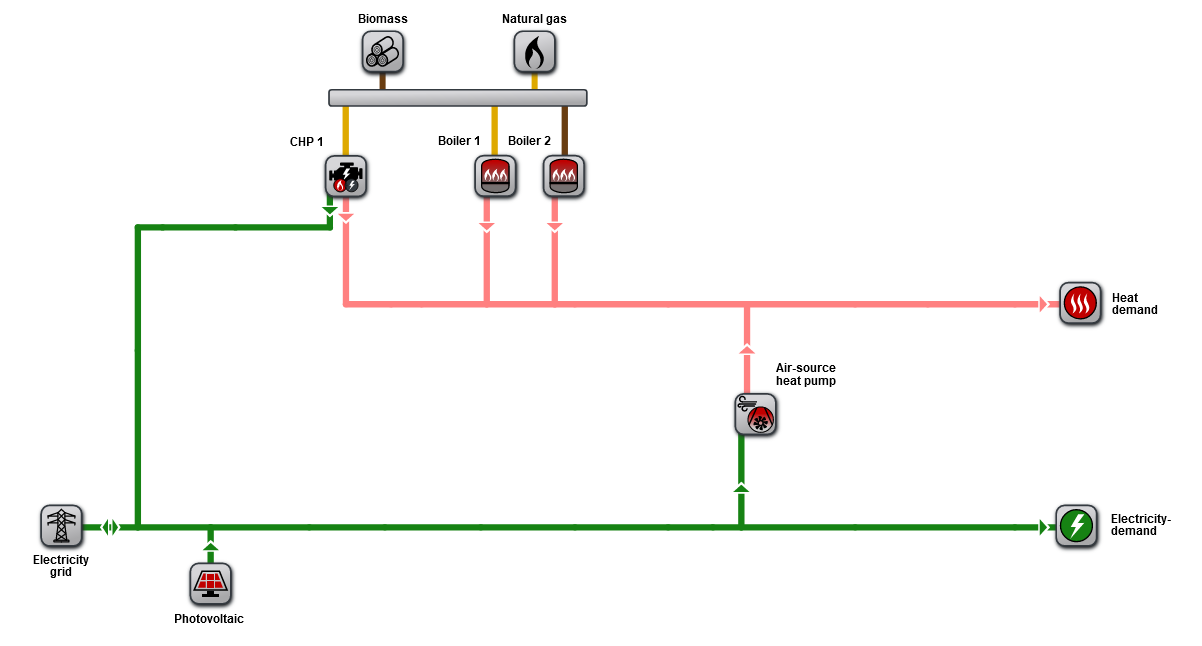
To determine the impact of the different modeling approaches on the result of the generated heat, the identical energy system with the same technology parameters was depicted in both, energyPRO and nPro. For this purpose, a heating plant for a heating network is simulated, which includes a combined heat and power plant (CHP), a natural gas boiler, a biomass boiler, and an air-to-water heat pump. The boundary conditions such as energy purchase costs are also identical. The plant configuration includes the following components:
- Biomass boiler with 500 kWth
- Combined heat and power plant (CHP) with 236 kWth
- Air-to-water heat pump with 453 kWth
- Peak load gas boiler with 1,852 kWth
| Biomass boiler | CHP unit | Heat pump | Gas boiler | |
|---|---|---|---|---|
| Nominal power | 500 kW | 236 kW | 300 kW | 1,800 kW |
| Minimum output | 300 kW | 236 kW | 50 kW | 600 kW |
| Start-up ramp | enabled | enabled | enabled | enabled |
| Shutdown ramp | enabled | enabled | enabled | enabled |
| Minimum operating duration | 72 h | 2 h | 0.5 h | 0.1 h |
| Biomass boiler | CHP unit | Heat pump | Gas boiler | |
|---|---|---|---|---|
| Nominal power | 500 kW | 236 kW | 300 kW | 1,800 kW |
| Minimum output | x | x | x | x |
| Start-up ramp | x | x | x | x |
| Shutdown ramp | x | x | x | x |
| Minimum operating duration | x | x | x | x |
Results of the comparison
The comparison of the heat generation for every technology, the share of the total heat generation, and the deviation of the results from nPro compared to energyPRO is shown in Table 3. The result shows a deviation of less than one percent for all generation technologies. This indicates that the simplified modeling of operational behavior in nPro leads to a very similar result compared to energyPRO. A similar result is found in the scientific study by Wirtz et al. (2021), which examined the impact of depicting detailed operational behavior on the design outcome for mixed-integer optimization models.
| Heat generation unit | energyPRO | energyPRO | nPro | nPro | Deviation |
|---|---|---|---|---|---|
| Biomass boiler | 4,031 MWh | 55.6 % | 4,036 MWh | 55.6 % | -0.07 % |
| Heat pump | 1,520 MWh | 21.0 % | 1,505 MWh | 20.7 % | 0.21 % |
| CHP unit | 891 MWh | 12.3 % | 942 MWh | 13.0 % | -0.70 % |
| Gas boiler | 813 MWh | 11.2 % | 774 MWh | 10.7 % | 0.54 % |
| Total | 7,255 MWh | 100.0 % | 7,257 MWh | 100.0 % | -0.03 % |