

Objective and approach
The methods implemented in nPro for determining the connection loads of heat transfer stations and for the dimensioning of the pipe network were verified using an exemplary district with a heating network. The district is a typical new-build development in North Rhine-Westphalia (Germany), whose building structure is representative of many district-scale projects in Germany. The planning documents of this district serve as the reference; they specify the connection loads for each building and the nominal diameters for each route section. The results of both calculation steps are compared below.
Description of the district
The district under investigation consists of residential buildings built to new-build standards and a kindergarten. The residential buildings comprise 18 single-family houses (16 terraced houses and 2 detached buildings) and 5 multi-family houses. In total, 24 heat transfer stations supply 105 dwelling units with a floor area of approximately 8,500 m².
| Building type | Number | Dwelling/usage units | Floor area per building |
|---|---|---|---|
| MFH 1, new build | 1 | 14 | 850 m² |
| MFH 2, new build | 1 | 24 | 1,250 m² |
| MFH 3, new build | 1 | 22 | 1,470 m² |
| MFH 4, new build | 1 | 16 | 1,400 m² |
| MFH 5, new build | 1 | 11 | 600 m² |
| SFH (terraced house), new build | 16 | 1 | 110 m² |
| SFH (detached), new build | 2 | 1 | 220 m² |
| Kindergarten, new build | 1 | 1 | 700 m² |
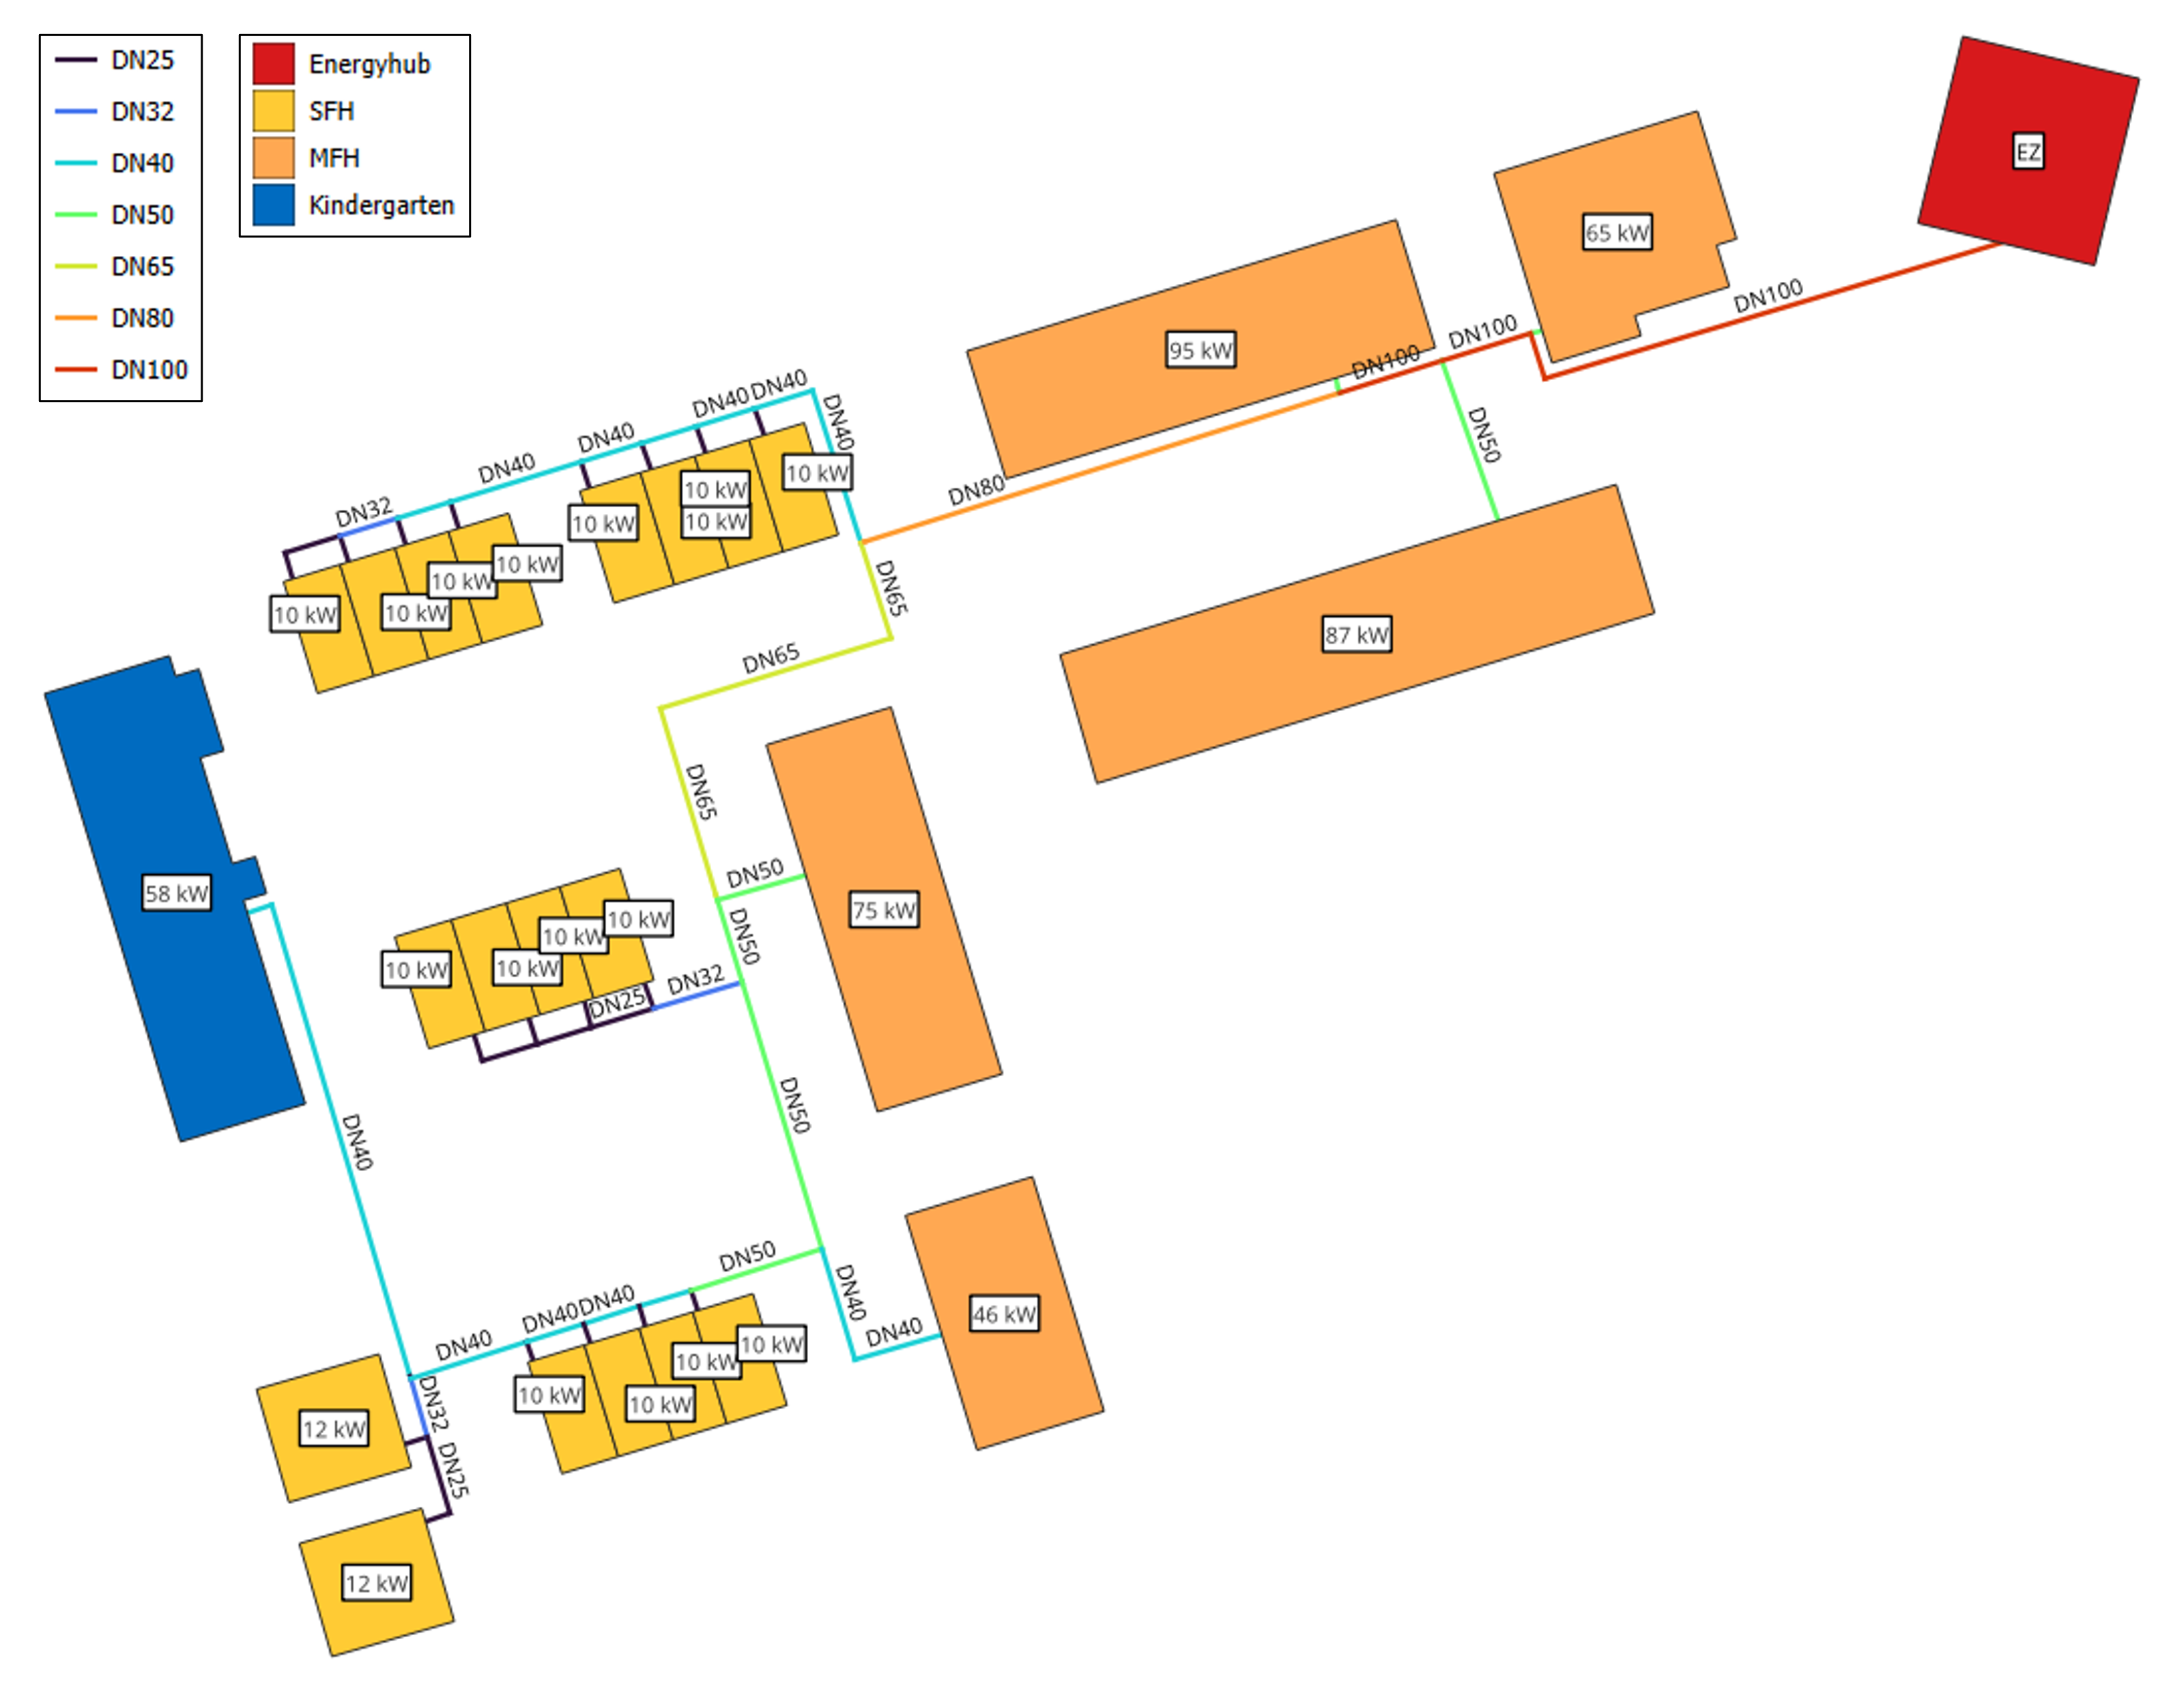
Part 1: Connection loads of the heat transfer stations
The connection loads of the heat transfer stations result from the interaction of the tapping profile, simultaneity effects, the type of domestic hot water supply and the storage management. The connection loads calculated in nPro are compared below with the values stated in the reference design.
Assumptions and boundary conditions
| Parameter | Value |
|---|---|
| Location / climate data set | Germany (Cologne) |
| Building standard, residential buildings | KfW 55, new build |
| Building standard, non-residential buildings | New build, kindergarten use |
| Supply/return temperature (network) | 70 / 48 °C |
| Supply/return temperature (building) | 65 / 45 °C |
| Tapping profile | Standard (16 l/min, approx. 35 kW) |
| DHW supply | MFH, kindergarten: decentralized; SFH: centralized |
| Reheating time of the DHW storage | MFH, kindergarten: 30 min; SFH: 60 min |
Results
The results of the sizing of the heat transfer stations in nPro are shown below.
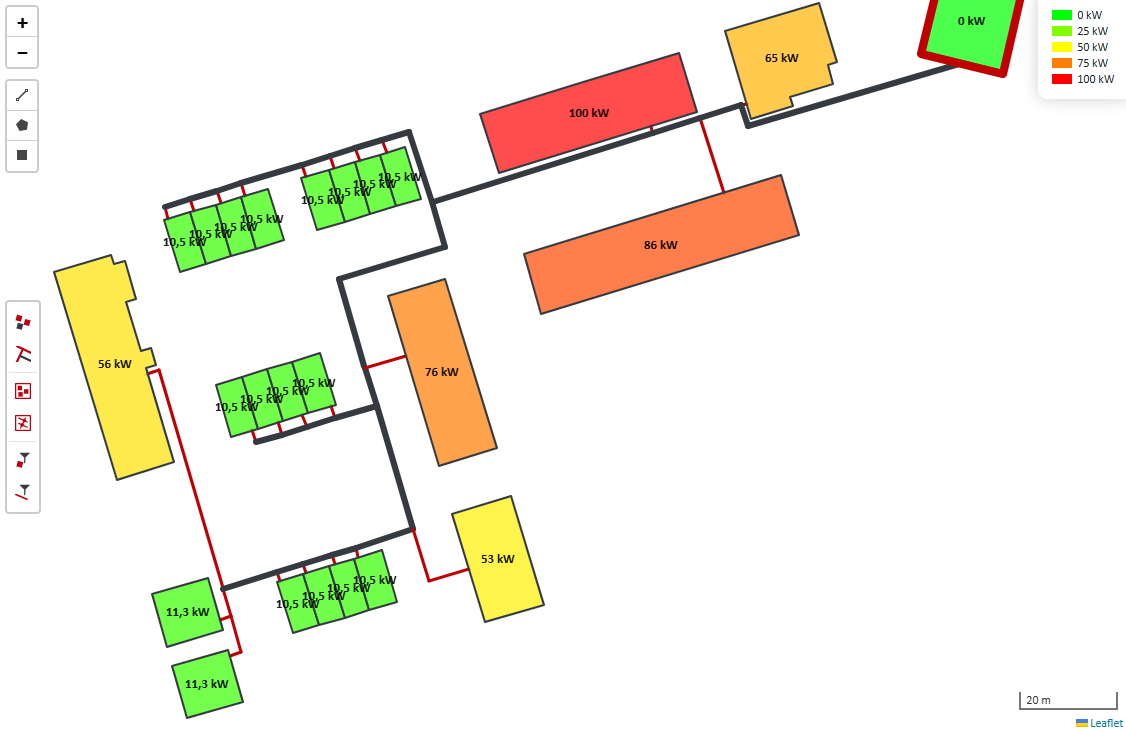
| Building | Number | Connection load reference | Connection load nPro | Deviation | Mean absolute deviation |
|---|---|---|---|---|---|
| Multi-family houses | 5 | 368 kW | 380.0 kW | 3.3% | 4.6% |
| MFH 1 (14 DU) | 1 | 65 kW | 65.0 kW | 0.0% | |
| MFH 2 (24 DU) | 1 | 95 kW | 100.0 kW | 5.3% | |
| MFH 3 (22 DU) | 1 | 87 kW | 86.0 kW | -1.1% | |
| MFH 4 (16 DU) | 1 | 75 kW | 76.0 kW | 1.3% | |
| MFH 5 (11 DU) | 1 | 46 kW | 53.0 kW | 15.2% | |
| Single-family houses | 18 | 184 kW | 190.6 kW | 3.6% | 5.1% |
| SFH (terraced house) | 16 | 10 kW | 10.5 kW | 5.0% | |
| SFH (detached) | 2 | 12 kW | 11.3 kW | -5.8% | |
| Kindergarten | 1 | 58 kW | 56.0 kW | -3.4% | 3.4% |
| District | 24 | 610 kW | 626.6 kW | 2.7% | 4.9% |
Across all 24 heat transfer stations, the mean absolute deviation of the connection loads is 4.9%. It amounts to 4.6% for the multi-family houses, 5.1% for the single-family houses and 3.4% for the kindergarten, which means that all building types are represented with comparable accuracy across the entire load range. Only one building deviates more markedly, by 15.2%. Since the boundary conditions of the reference design are not known in full detail, this deviation can be attributed to differing assumptions regarding the domestic hot water supply.
Part 2: Dimensioning of the pipe network
Based on the connection loads of the buildings, the mass flows are derived from the design temperature difference between supply and return and are aggregated for the individual route sections taking simultaneity into account. The nominal diameter of a section then follows from the permissible specific pressure gradient and the available range of pipe sizes. The nominal diameters selected in nPro are compared below with the nominal diameters stated for each route section in the reference design.
Assumptions and boundary conditions
For the dimensioning, the route layout was reproduced in nPro and a pipe type matching the reference design was used. Further boundary conditions are listed in the following table.
| Parameter | Value |
|---|---|
| Pipe type, distribution pipes | Plastic (single pipe) |
| Pipe type, service connection pipes | Plastic (twin pipe) |
| Supply/return temperature | 70 / 48 °C |
| Maximum pressure gradient | 200 Pa/m |
| Roughness | 0.007 mm |
| Available nominal diameters | DN 20 to DN 150 |
| Total route length | 485 m |
Results
The results of the pipe dimensioning in nPro are shown below.
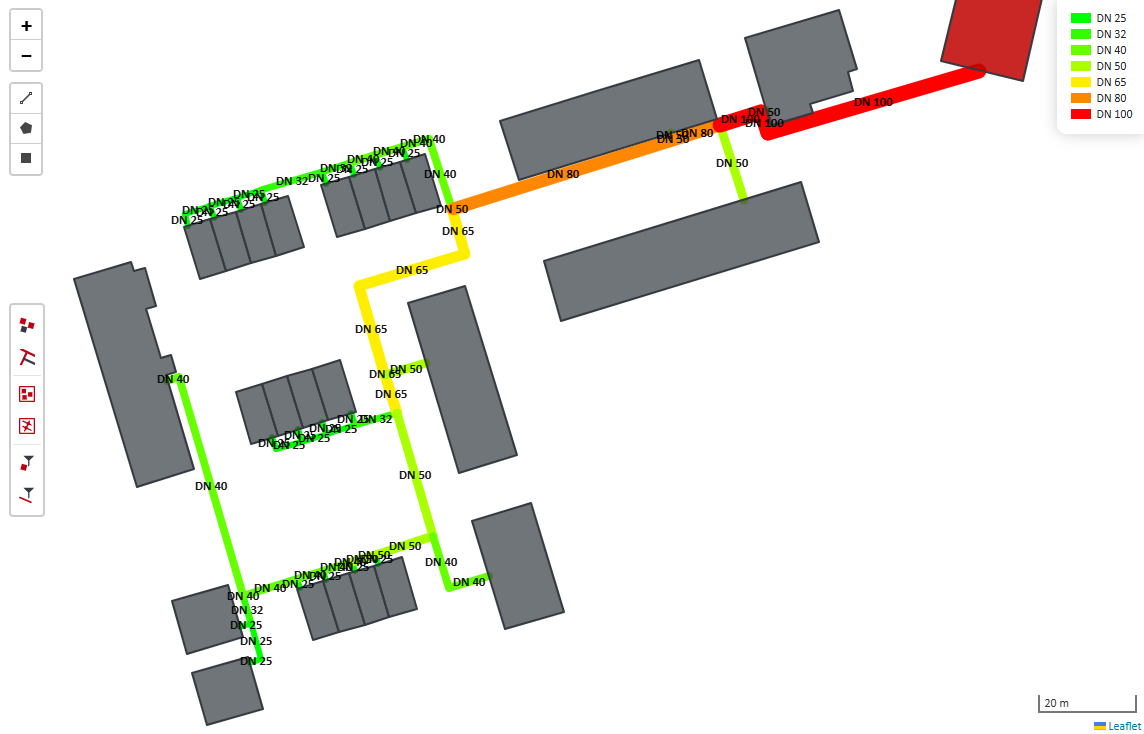
Of the 63 route sections in total, 56 sections are assigned the same nominal diameter by both tools. The remaining 7 sections relate to 3 locations in the pipe network and are sized in nPro one diameter smaller or larger than in the planning documents of the reference project. Since the reference design does not state any sizing parameters beyond the pipe type, the deviation can be attributed to unknown assumptions regarding the pipe roughness or the permissible pressure gradient, both of which directly influence the choice of nominal diameter. The route sections with deviating nominal diameters are shown in Figure 4 and are highlighted in red.
Discussion of the results
The following figure summarizes the comparison of the results obtained in nPro with the planning data of the reference project.
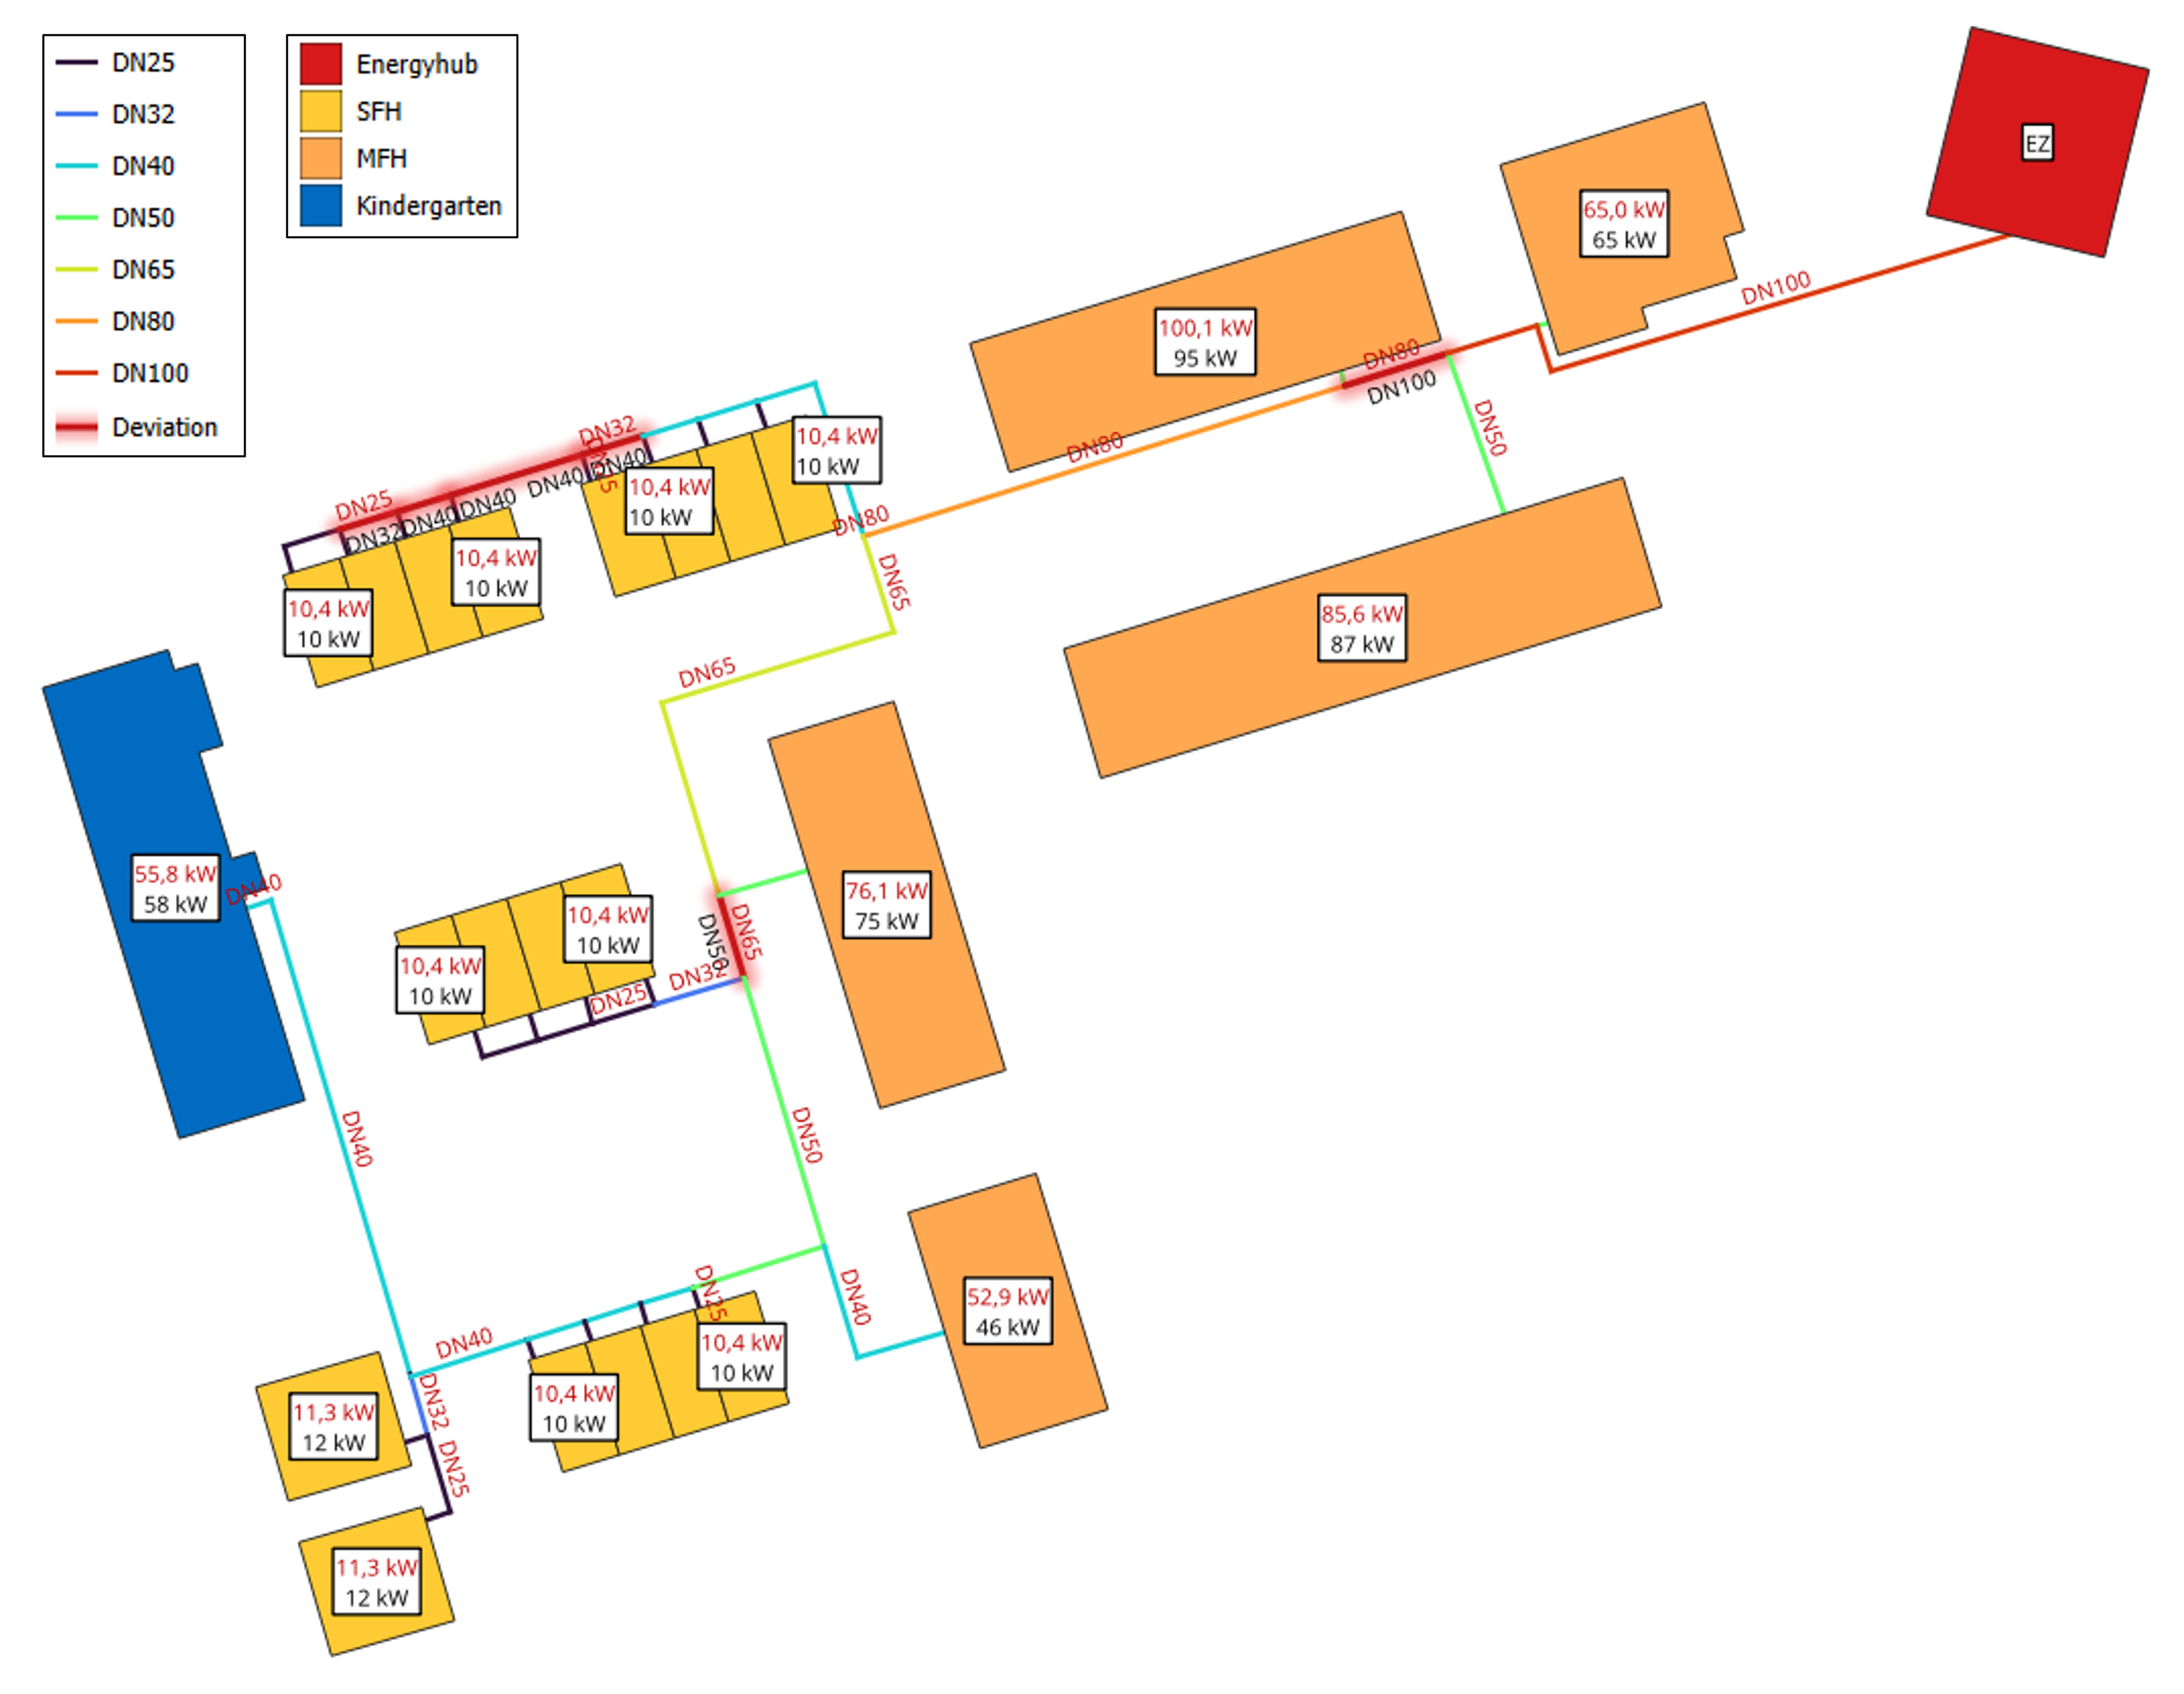
Overall, the methods implemented in nPro reproduce both the connection loads of the heat transfer stations and the nominal diameters of the pipe network in good agreement with the reference design. Across all 24 heat transfer stations, the mean absolute deviation of the connection loads is 4.9%. With 4.6% for the multi-family houses, 5.1% for the single-family houses and 3.4% for the kindergarten, all building types are represented with comparable accuracy across the entire load range. In the pipe dimensioning, both tools select the same nominal diameter in 56 of 63 route sections, which corresponds to an agreement of 89%. The remaining differences are attributable to the fact that the boundary conditions of the reference design are not documented in full detail and could therefore not be reproduced completely.
Sources
- Planning documents of the district under investigation (not publicly available)