

The nPro Building Atlas provides Germany-wide building data for heat demand calculations, district analyses and heat network planning. Building data can be retrieved directly in nPro and used for further project work – with no separate GIS databases, external interfaces or time-consuming manual data preparation.
Note: This module is currently only available for Germany.
What is the nPro Building Atlas™?
The energy analysis of a district requires information about the existing buildings. This includes, for example, the building geometry, building height, building type, construction year and heated floor area.
Such information is often spread across different data sources, comes in different data formats, or first has to be linked together. The nPro Building Atlas brings suitable building data together, harmonizes it and makes it available in a uniform structure directly in nPro.
Three steps to your data basis
Data is retrieved directly in nPro – without detours via external GIS software, databases or format conversions.
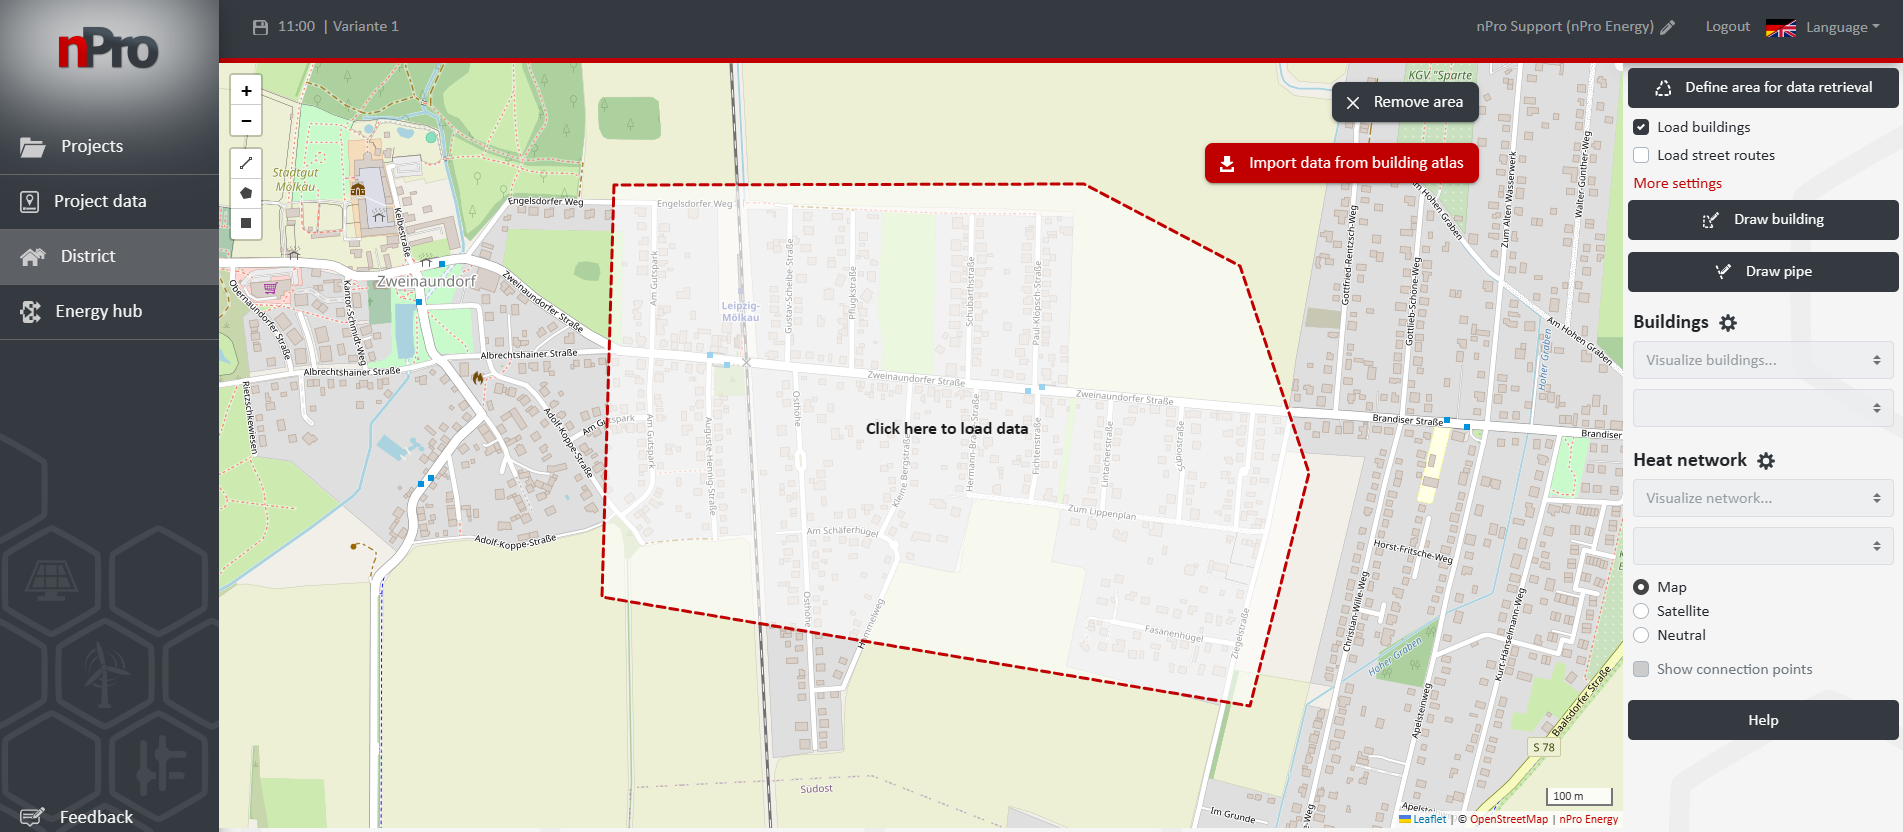
- Select the area: The study area is delineated on the map. All buildings within it are captured.
- Retrieve the data: For each building, geometry, type, construction year, floor area and heat demand are taken from the Building Atlas and loaded into the project as a building list.
- Review and adjust: All values can be inspected in the project and corrected, supplemented or replaced with your own survey and consumption data on a building-by-building basis.
A district with several hundred buildings can be set up in a matter of minutes – a data basis that used to take days of GIS work.
Which building data is included?
The nPro Building Atlas provides a structured and harmonized list of attributes for each building. Building type and building specification are classified according to the nPro software’s own taxonomy, so the data can be processed further without additional mapping steps.
| Attribute | Unit / format | Use in nPro |
|---|---|---|
| Building geometry | Polygon, georeferenced (GIS-compatible) | Display of the building, calculation of geometric parameters and spatial assignment |
| Footprint area | m² | Basis for determining the floor area |
| Building height | m | Estimation of building volume and thermal envelope area |
| Number of storeys | Count | Determination or plausibility check of the building floor area |
| Floor area | m² | Key input variable for the heat demand calculation |
| Building type1 | Classification (e.g. residential, school) | Selection of suitable building parameters and assignment of demand profiles for residential and non-residential buildings |
| Building specification1 | Classification | Further differentiation within the building type, e.g. for typical usage profiles |
| Construction year or construction period class | Year or class | Assignment of typical building energy standards |
| Annual space heating demand | kWh/a | Basis for network sizing, plant dimensioning and economic analysis |
| Annual domestic hot water demand | kWh/a | Basis for network sizing, plant dimensioning and economic analysis |
| Address | Text | Identification and assignment of individual buildings |
1Classification follows the building type and specification logic used in nPro.
Depending on the region, the available data basis and the individual building, not all attributes are available for every building. Missing information may have been derived – depending on the attribute concerned – from geometric relationships, statistical data or building typologies. The values provided can then be reviewed and adjusted individually within the project.
How reliable is the data (validation)?
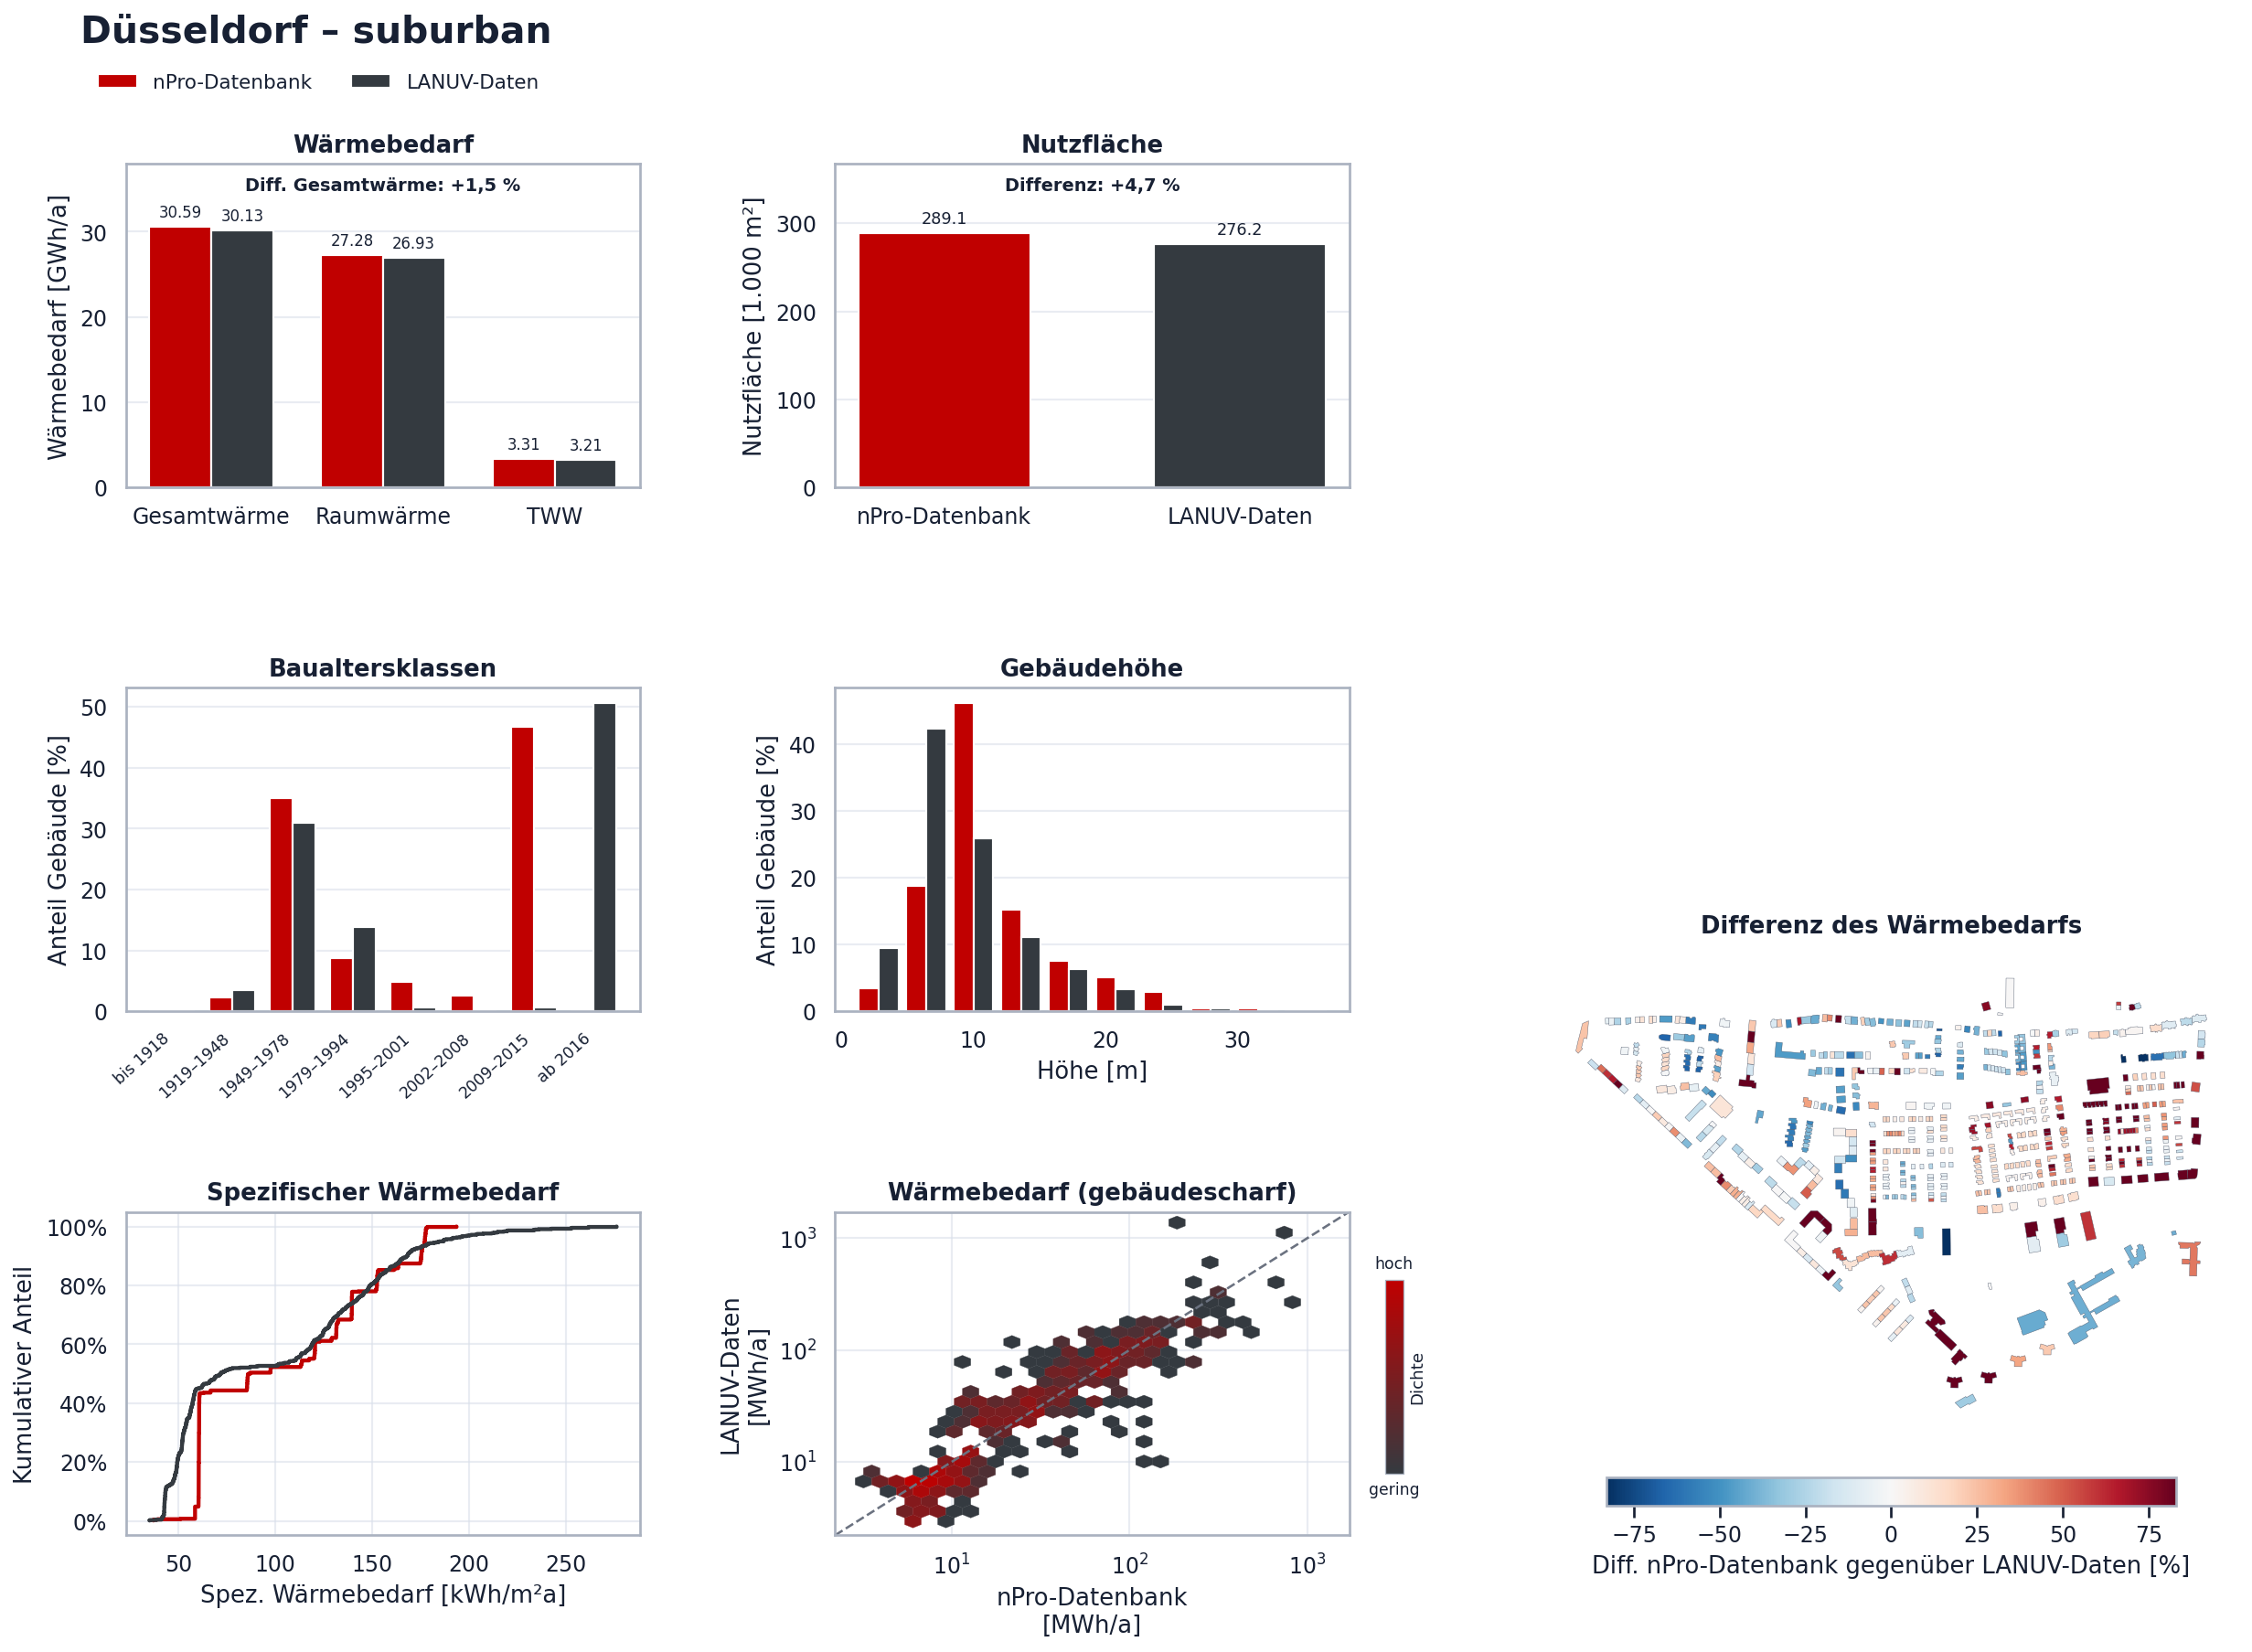
Automatically provided building data is only an advantage if the heat demands calculated from it are reliable. We therefore compared the nPro Building Atlas with the official heat demand model of LANUV NRW across seven study areas – ranging from densely built-up city centres to scattered rural settlements. The mean absolute deviation of the total heat demand is 5.3 %, and in five of the seven areas it remains below 7 %. This is a solid basis for area-level balances, heat densities and the preliminary assessment of heat network areas; for individual buildings, reviewing the values remains advisable. All results, including the deviations, can be found on the page on the validation of the nPro Building Atlas.
Where does the data come from?
The nPro Building Atlas combines various public, official data sources. Depending on the region and data availability, these include in particular:
- official 3D building models and building coordinates of the German federal states,
- data from the building and housing census of the 2022 Census,
- regional or state-specific heat cadastres,
- other publicly available geodata and statistical data.
The data sources differ in terms of spatial resolution, survey date and the building attributes they contain, among other things. The data is therefore technically processed, standardized and – wherever possible – merged at building level before use.
Typical applications
The nPro Building Atlas is particularly useful in the early project phase, when a uniform data basis is needed quickly for larger areas.
- Creating district and building models
- Estimating the heat demand of buildings
- Feasibility studies and transformation plans for heat networks
- Investigating potential heat network areas
- Comparing centralized and decentralized supply solutions
How do I get access to the Building Atlas?
The nPro Building Atlas is part of the nPro Plus license. It is therefore available to all Plus users at no additional cost: building data is retrieved directly in nPro and is immediately ready for further project work.
Usage is offered as a flat rate – building data can be retrieved for any number of areas, with no limit on the number of projects or buildings. This assumes normal project use as part of planning work; systematic bulk retrieval of data outside of specific projects is not permitted (current technical limit: 10.000 buildings/user/month).
Sample datasets
You can download a sample dataset for each federal state:
Licenses and data versions
The building data is based on a combination of several official and open data sources (varying by federal state). These are merged and harmonized into a uniform data model to ensure a consistent and reliable data basis.
| Source | License | Version | Attribution |
|---|---|---|---|
| Census 2022 – grid data | Data licence Germany – attribution – version 2.0 (DL-DE/BY-2.0) | Reference date 15 May 2022, data version used: 4 November 2024 | Statistical Offices of the Federation and the Länder |
| NRW heat demand model (LANUV) | Data licence Germany – Zero – version 2.0 (DL-DE-zero-2.0) | 17 December 2024 | Landesamt für Natur, Umwelt und Verbraucherschutz Nordrhein-Westfalen (LANUV), OpenGeoData.NRW |
| Wärmeatlas Baden-Württemberg | Data licence Germany – attribution – version 2.0 (DL-DE/BY-2.0) | February 2025 | Data source: LGL, www.lgl-bw.de processed by geomer, www.geomer.de | ifeu, www.ifeu.de | GEF, www.gef.de | dl-de/by-2-0 www.govdata.de/dl-de/by-2-0 | https://opengeodata.lgl-bw.de/ |
| 3D building model Baden-Württemberg (CityGML) | Data licence Germany – attribution – version 2.0 (DL-DE/BY-2.0) | April 2026 | Data source: LGL, www.lgl-bw.de |
| 3D building model Bavaria (CityGML) | Creative Commons Attribution 4.0 International (CC-BY 4.0) | August 2026 | Bayerische Vermessungsverwaltung – www.geodaten.bayern.de |
| 3D building model Berlin (CityGML) | Data licence Germany – Zero – version 2.0 (DL-DE-zero-2.0) | March 2026 | Senatsverwaltung für Stadtentwicklung, Bauen und Wohnen, Berlin |
| 3D building model Brandenburg (CityGML) | Data licence Germany – attribution – version 2.0 (DL-DE/BY-2.0) | July 2026 | GeoBasis-DE / LGB (Landesvermessung und Geobasisinformation Brandenburg) |
| 3D building model Bremen (CityGML) | Creative Commons Attribution 4.0 International (CC-BY 4.0) | July 2025 | Landesamt GeoInformation Bremen |
| 3D building model Hamburg (CityGML) | Data licence Germany – attribution – version 2.0 (DL-DE/BY-2.0) | March 2026 | Freie und Hansestadt Hamburg, Landesbetrieb Geoinformation und Vermessung (LGV) |
| 3D building model Hesse (CityGML) | [Hessisches Vermessungs- und Geoinformationsgesetz – HVGG §18] (https://www.rv.hessenrecht.hessen.de/perma?d=jlr-NNLHE00005568NN00000000056) | June 2026 | Hessische Verwaltung für Bodenmanagement und Geoinformation |
| 3D building model Mecklenburg-Western Pomerania (CityGML) | Creative Commons Attribution 4.0 International (CC-BY 4.0) | March 2026 | © GeoBasis-DE/M-V |
| 3D building model Lower Saxony (CityGML) | Creative Commons Attribution 4.0 International (CC-BY 4.0) | April 2026 | Landesamt für Geoinformation und Landesvermessung Niedersachsen (LGLN) (2026) |
| 3D building model North Rhine-Westphalia (CityGML) | Data licence Germany – Zero (DL-DE/0-2.0) | May 2026 | Geobasis NRW |
| 3D building model Rhineland-Palatinate (CityGML) | Data licence Germany – attribution (DL-DE/BY-2.0) | April 2026 | ©GeoBasis-DE / LVermGeoRP 2026, dl-de/by-2-0, www.lvermgeo.rlp.de [data processed] |
| 3D building model Saarland (CityGML) | Data licence Germany – attribution (DL-DE/BY-2.0) | June 2026 | © GeoBasis DE/LVGL-SL (2026) |
| 3D building model Saxony (CityGML) | Data licence Germany – attribution (DL-DE/BY-2.0) | July 2025 | GeoSN (Landesamt für Geobasisinformation Sachsen) |
| 3D building model Saxony-Anhalt (CityGML) | Data licence Germany – attribution (DL-DE/BY-2.0) | April 2026 | © GeoBasis-DE / LVermGeo ST |
| 3D building model Schleswig-Holstein (CityGML) | Creative Commons Attribution 4.0 (CC BY 4.0) | June 2024 | ©GeoBasis-DE/LVermGeo SH/CC BY 4.0 (source modified) |
| 3D building model Thuringia (CityGML) | Data licence Germany – attribution (DL-DE/BY-2.0) | July 2026 | © GDI-Th (Thüringer Landesamt für Bodenmanagement und Geoinformation) |
Notes on data accuracy and suitability
The values provided – particularly the heat demands – are based on available official and open data sources as well as methodological processing and harmonization. Coverage, timeliness and level of detail may vary by region. The data is intended as a basis for planning and analysis and does not replace an on-site building-level survey. nPro gives no warranty as to the accuracy, completeness or suitability of the data for any particular purpose. Users should review the data critically and supplement it with their own surveys where necessary.