
nPro offers Excel exports at numerous points, allowing input and result data to be processed further with ease.
| Export | Contents |
|---|---|
| Building details | Building parameters of an individual building (example) |
| Building list | List of all buildings in the heating network, input and result parameters, summary of demands by building type (example) |
| Pipe list | List of all pipes in the heating network, input and result parameters, summary by pipe diameter (example) |
| Fittings list | List of all fittings in the heating network (basis: network topology, pipe type) (example) |
| Load profiles | Load profiles in monthly and hourly resolution, overview of the district’s heating, cooling and electricity demand, summary of demands by building (also available as CSV, TXT and Modelica TXT) (example) |
| Temperature profiles and heat losses | Temperature profiles (supply, return, ground) and heat losses of heating networks in hourly resolution (example) |
| Energy hub (generators) | Energy generation per unit in hourly resolution (example) |
| Weather data | Weather data for the site in hourly resolution (example) |
| Results | Generators, economic efficiency, variant comparison (example) |
Building details
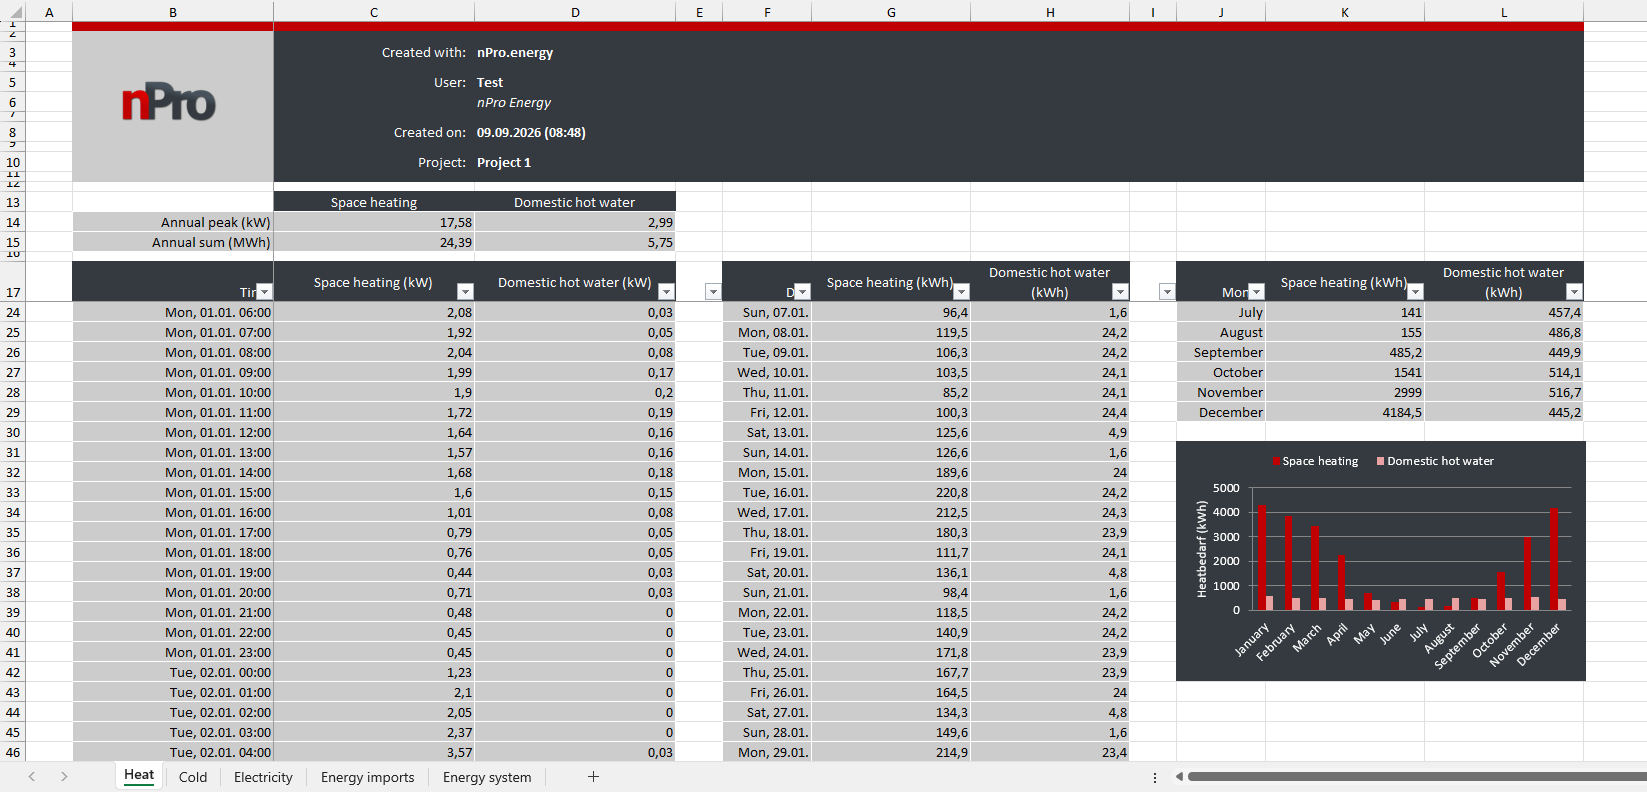
The export contains all demand profiles of an individual building, split across the worksheets heating, cooling, electricity, energy supply and energy system. Each sheet shows the profiles side by side in hourly, daily and monthly resolution, supplemented by the annual total and annual peak value. This makes it possible to trace space heating, domestic hot water, air conditioning, user electricity and e-mobility as well as the actual supply from the heating network for each building individually. (example)
Building list
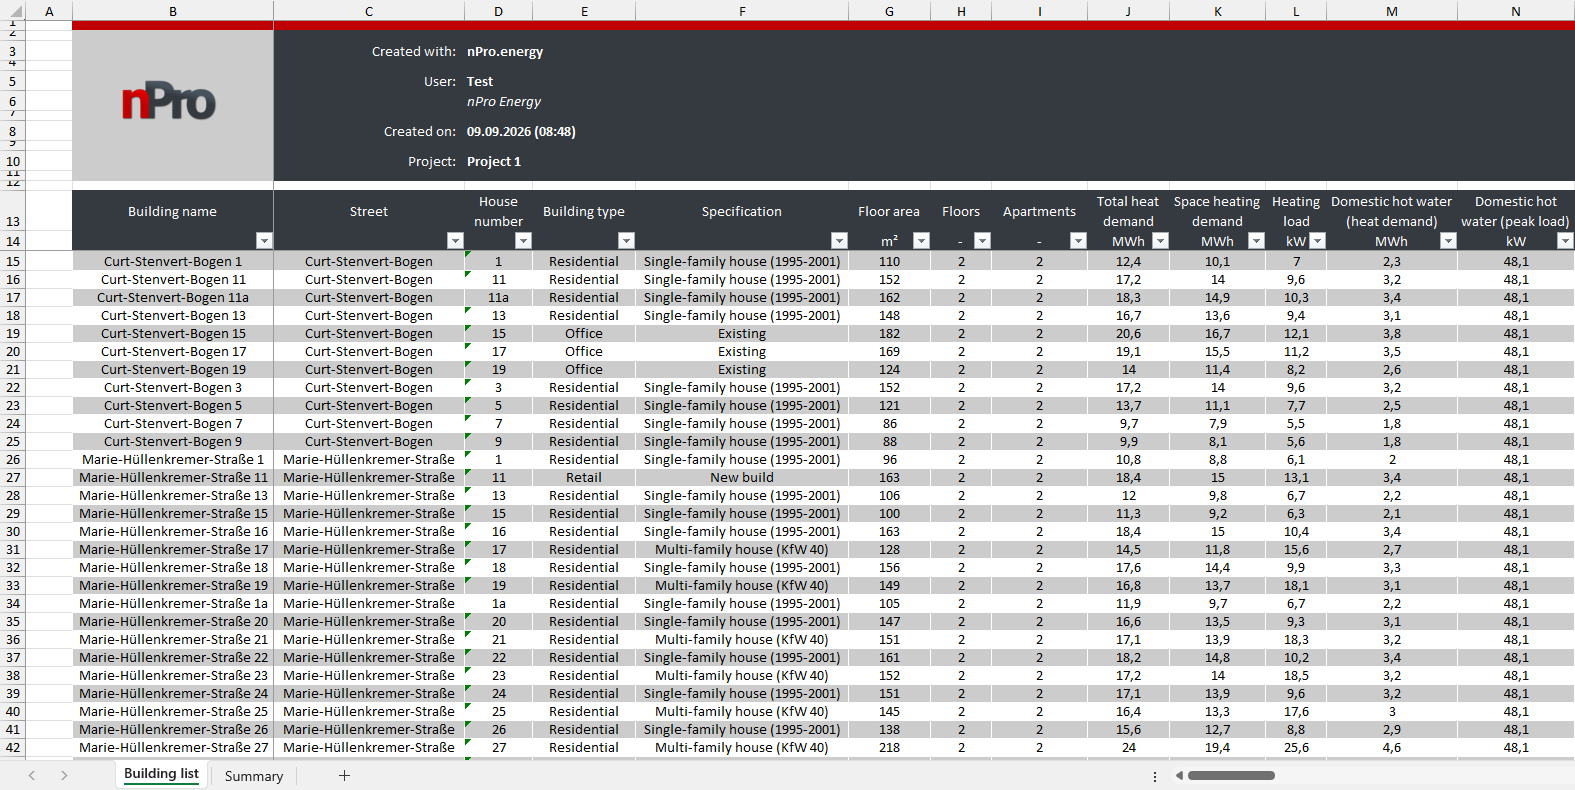
The building list summarises all buildings of the district in one table and contains, for each building, both the input parameters (address, building type, floor area, temperature levels, generators, storage) and the results of the calculation (demands, peak loads, heat supply, seasonal performance factors). A second worksheet aggregates the demands by building type and thus provides a quick overview of the structure of the supply area. (example)
Pipe list
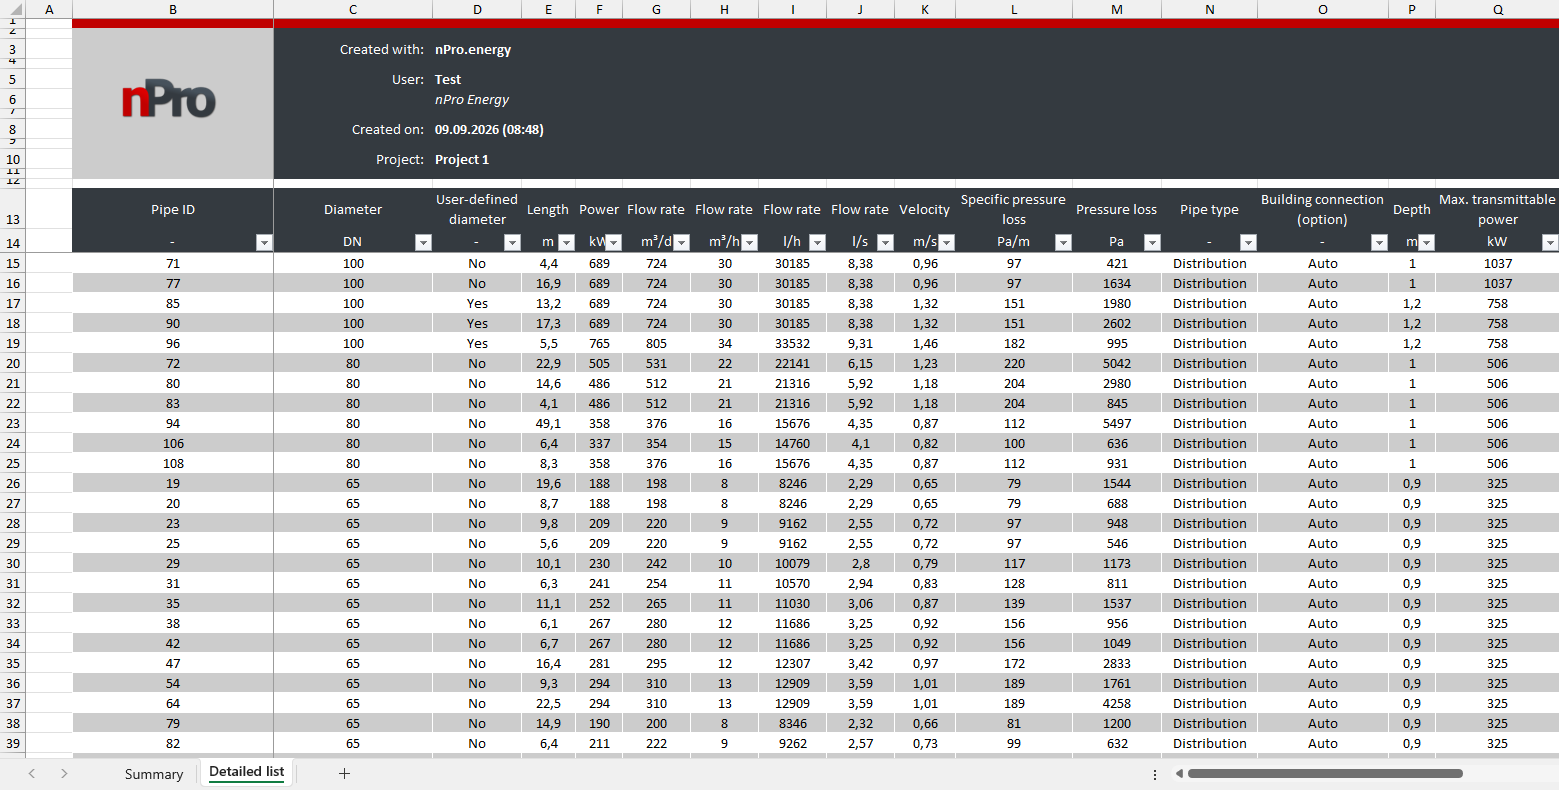
The pipe list documents the heating network on two levels: a summary by nominal diameter bundles pipe lengths, heat losses, pressure losses, water volumes as well as pipe and installation costs. The detailed list additionally provides the complete design and simulation results for each individual pipe section, including volume flow, flow velocity, utilisation, capacity reserve, linear heat density and pressure levels in the supply and return lines. (example)
Fittings list
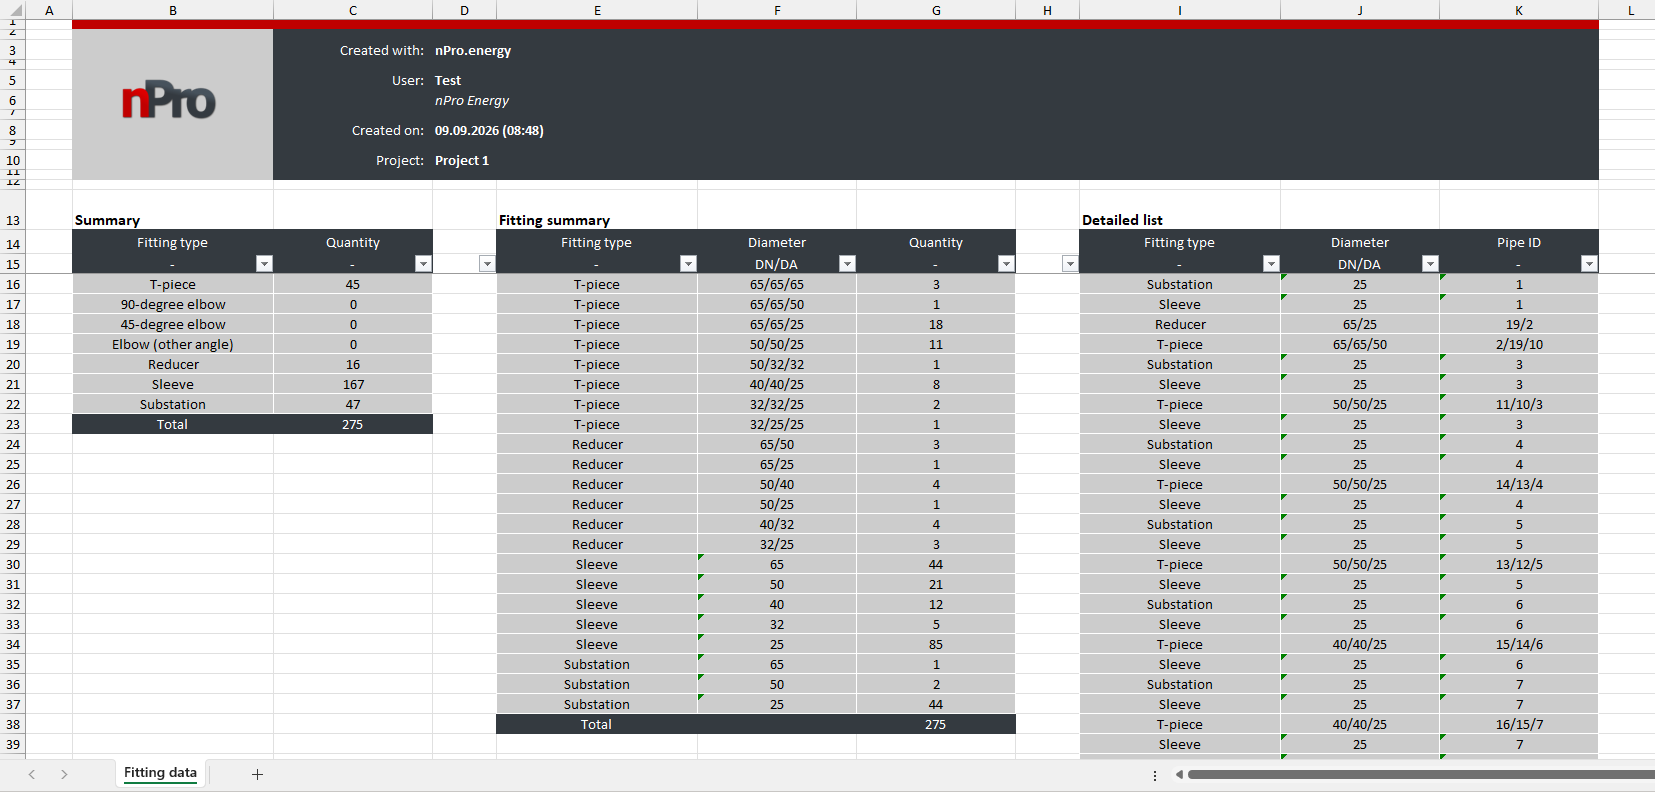
The fittings list derives all required fittings from the network topology and pipe type, from T-pieces and reducers to couplings and house connection stations. In addition to the total number per fitting type, the export contains a breakdown by nominal diameter as well as a detailed list with assignment to the respective pipe ID. (example)
Load profiles
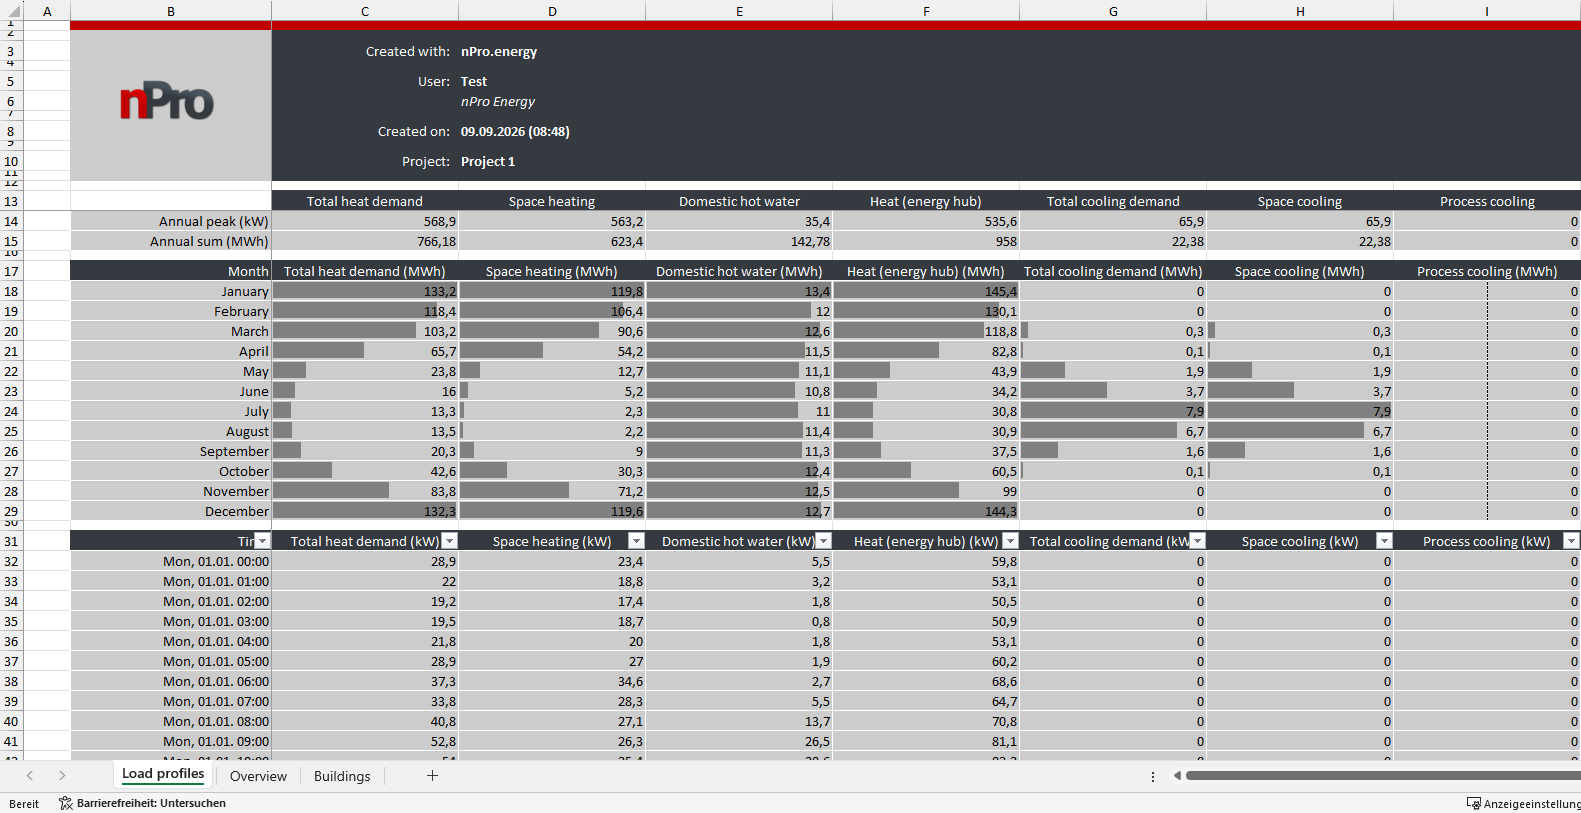
The export contains the load profiles of the entire district in hourly and monthly resolution, including heating, cooling and electricity demand, feed-in at the energy hub, auxiliary electricity, pumping energy and air temperature. An overview sheet summarises annual totals and peak loads, another breaks down the demands per building including area-specific key figures. The profiles are additionally available as CSV, TXT and Modelica TXT and can therefore be transferred directly into your own simulation models. (example)
Temperature profiles and heat losses
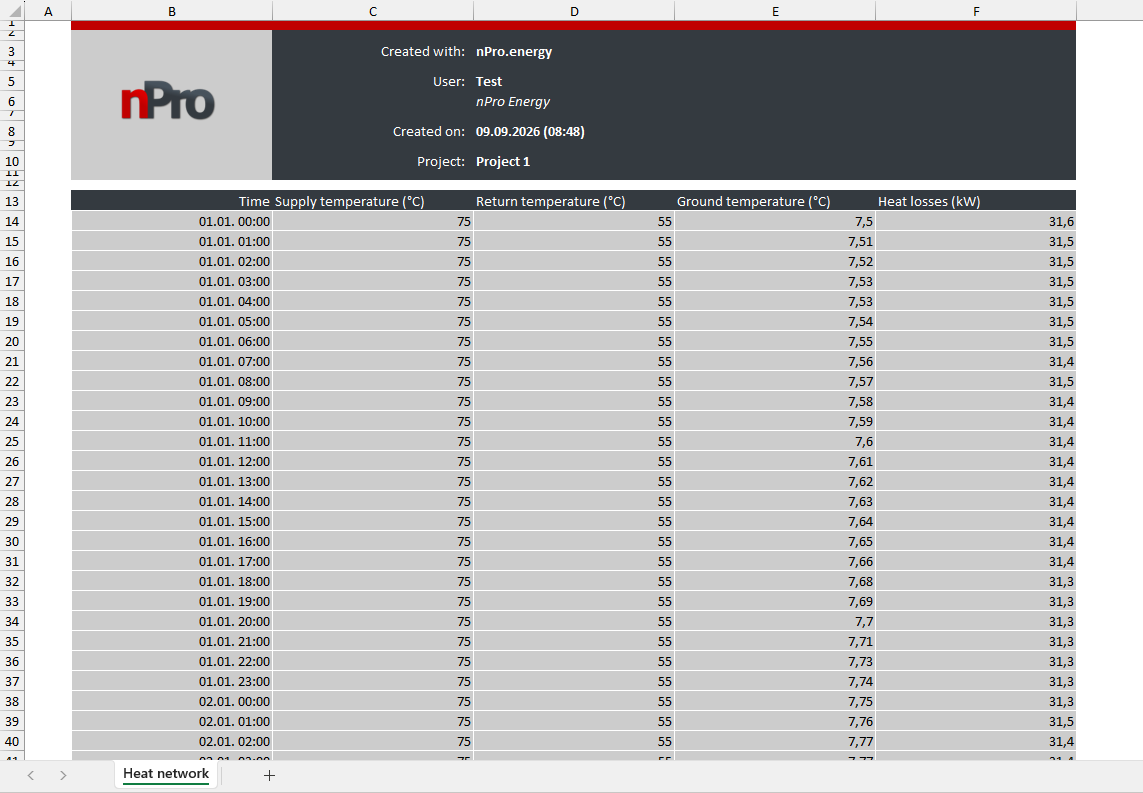
For each of the 8,760 hours of the year, the supply, return and ground temperatures as well as the resulting heat losses of the network are output. The export is therefore suitable for evaluating temperature reductions, comparing network topologies and analysing seasonal loss shares. (example)
Energy hub and weather data
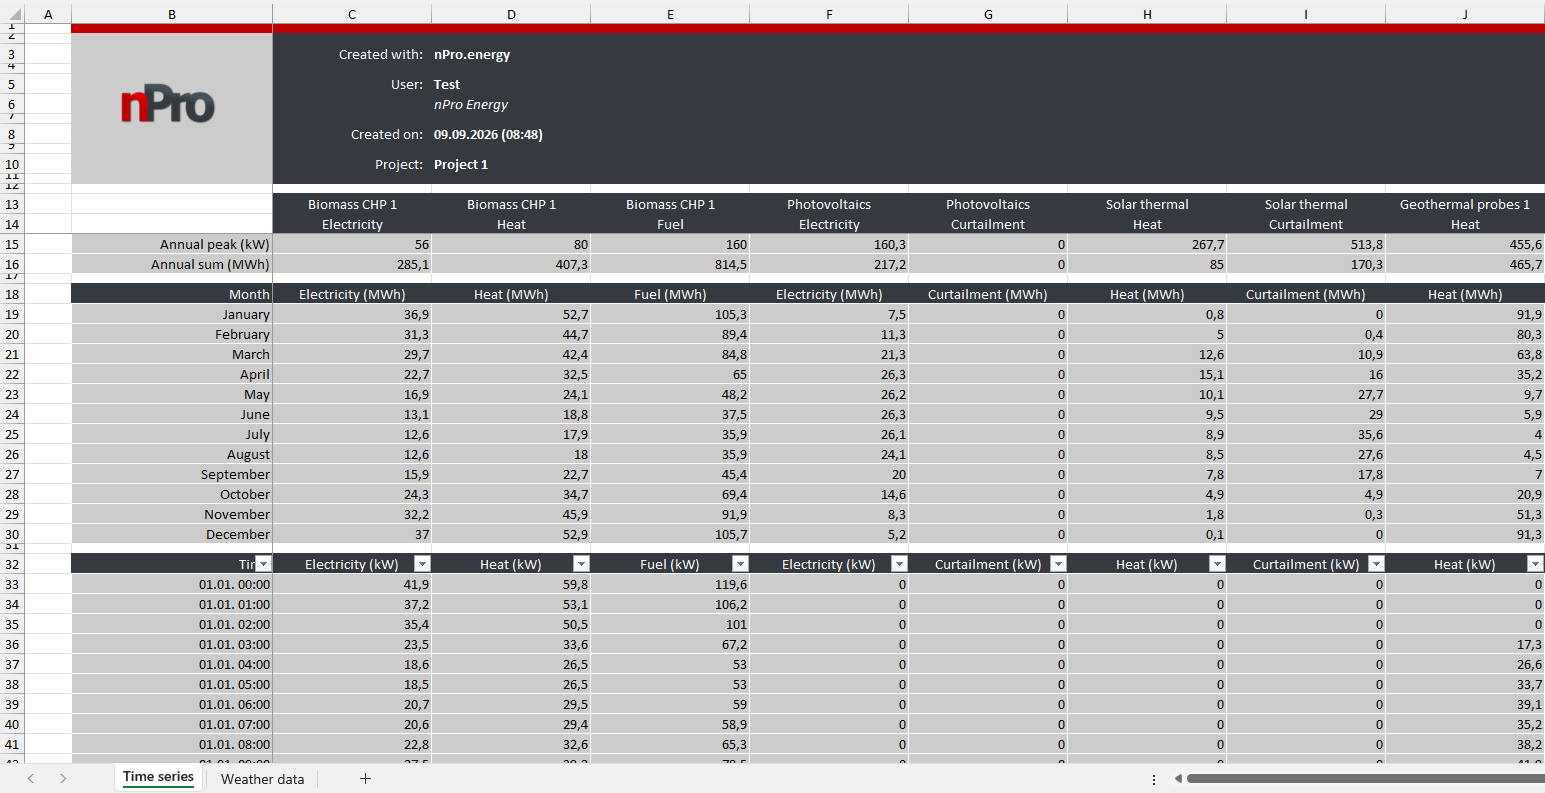
This export shows the energy generation for each unit of the energy hub individually, separated into electricity, heat, cooling, fuel input, curtailment and borehole regeneration. The values are available in hourly and monthly resolution, supplemented by annual totals and annual peak values per unit. This allows the operating mode, coverage shares and full load hours of the individual technologies to be evaluated in detail. The weather data used at the project site is output in hourly resolution, including air temperature, wind speed, global radiation, direct normal irradiance and horizontal infrared radiation. The export makes the boundary conditions of the simulation transparent and can be reused for your own calculations. (example)
Results
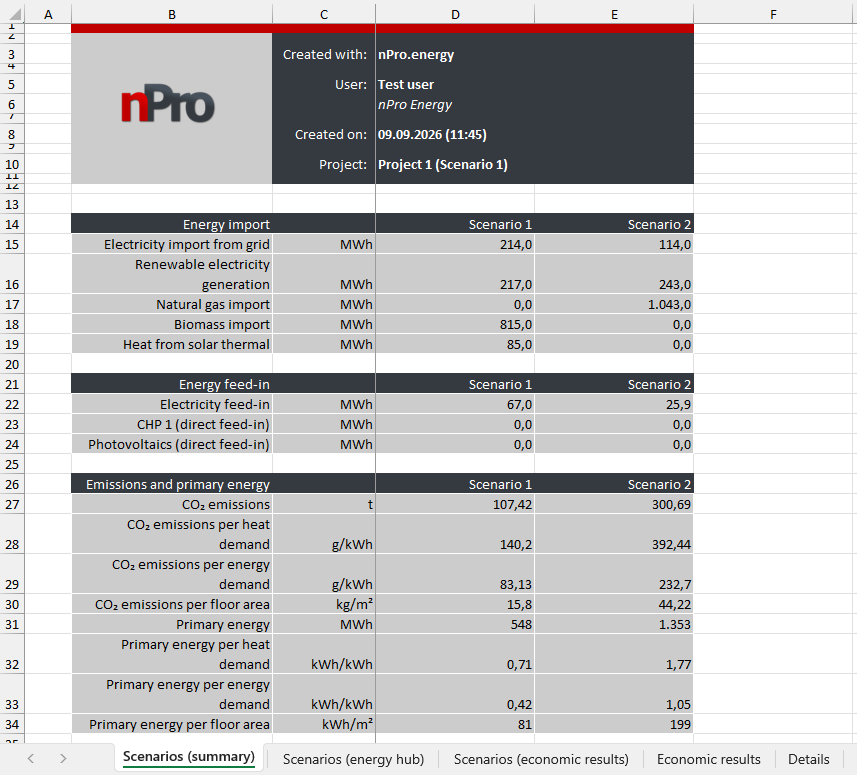
The results export bundles the key figures of the project: energy supply and feed-in, CO₂ emissions and primary energy, the sizing of each technology of the energy hub as well as the complete economic analysis with net present value, payback period, internal rate of return, subsidy rates and levelised cost of heat. All variables are additionally output as a direct variant comparison in opposing columns, supplemented by detailed key figures such as the degree of self-sufficiency and the self-consumption rate. (example)