

On this page you will learn how to include a heating curve in nPro for the calculation of a building energy system.
What is a heating curve?
The heating curve of a building energy system describes the supply temperature as a function of the ambient air temperature. If the ambient air temperature is very low in winter, the supply temperature is usually increased, e.g. from 60 °C to 80 °C. This causes the radiators (or underfloor heating) to give off more heat to the room. It also reduces the mass flow in the pipes, as the temperature difference between the flow and return increases. Lower mass flows result in lower pressure drop and smaller pumping work.
How does a heating curve look like and where are they used?
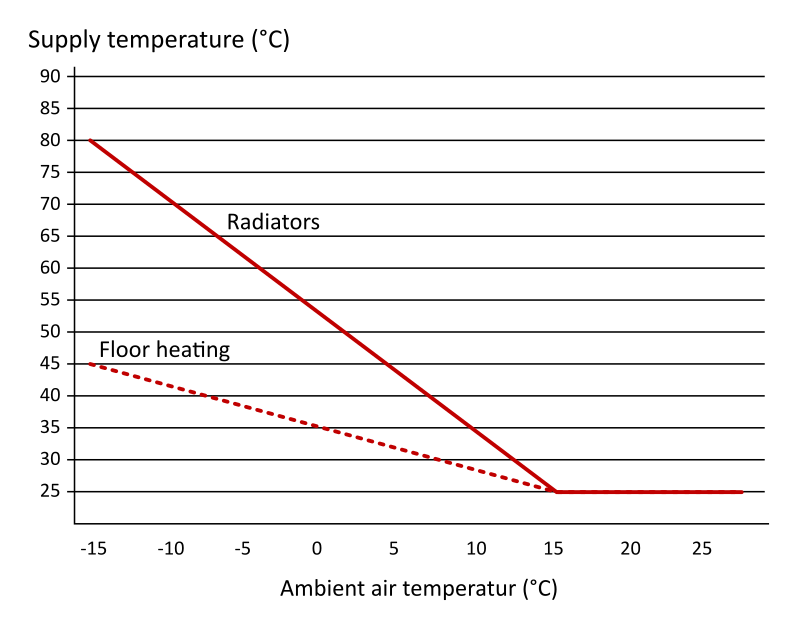
Two exemplary heating curves are shown in Figure 1. At the lowest ambient air temperature, the supply temperature is 45 °C for floor heating and 80 °C for radiators. At ambient temperatures above 15 °C, the building requires very little heating power and the supply temperature drops to 25 °C. In many cases, a linear relationship is assumed between maximum supply temperature in winter and the point of the lowest supply temperature in summer.
Accounting for heating curves in nPro
The heating curve for space heating can be activated in the building settings. Here, the maximum supply temperature can be defined, which is assumed at the time of the lowest outdoor air temperature. This setting is particularly relevant for cold district heating networks, since in cold networks, a water-to-water heat pump is installed in each building, which raises the temperature level of the heat from the district heating network to the supply temperature required by the building’s heating system. The efficiency of these heat pumps depends strongly on the temperature lift. This means that the lowest possible supply temperature in the building energy system should be targeted. This maximizes the COP of the heat pump and minimizes its electricity consumption.
How is the heating curve accounted for in nPro?
nPro uses the approach shown in Figure 1: at outdoor air temperatures of 15 °C or above, the supply temperature of the heating system is 25 °C. At the coldest hour of the year, the supply temperature equals the maximum supply temperature of the heating system specified by the user. Between these two points, for outdoor air temperatures below 15 °C, the supply temperature is linearly interpolated.