

On this page you will learn how to dimension pipe diameters of heating networks, cooling networks and 5th generation district heating and cooling (5GDHC) networks using the nPro tool.
Pipe sizing and dimensioning in nPro
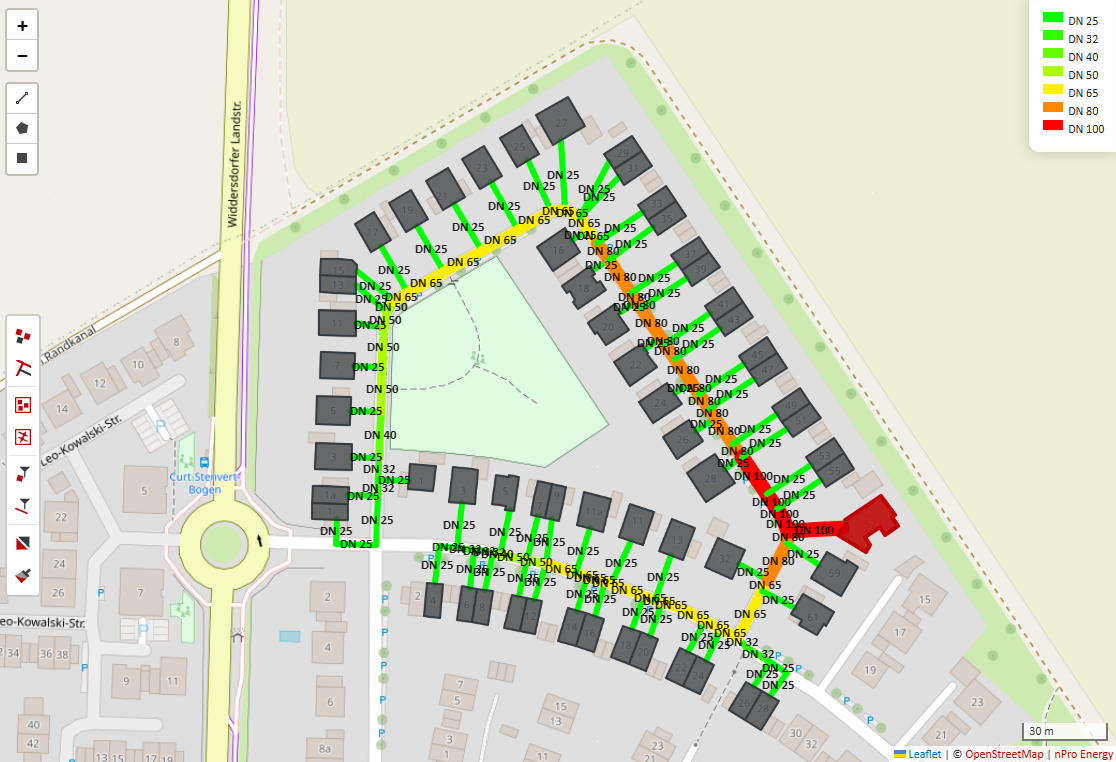
In the nPro tool, pipe diameters for district heating networks can be calculated precisely already in the early planning phase. Visualization takes place directly in the map view, see Figure 1.
Pressure loss calculation
The pressure loss in the pipe network is calculated using the Darcy-Weisbach equation, which relates the pressure gradient to flow velocity, pipe diameter, and friction factor:
where is the friction factor, the density of the fluid, the flow velocity, and the pipe diameter.
Friction factor
The friction factor depends on the flow regime, which is determined by the Reynolds number:
with as the dynamic viscosity of the fluid.
- Laminar flow ():
- Turbulent flow (): the friction factor is determined iteratively using the Colebrook-White equation:
where is the pipe roughness.
Validation of the pressure loss and diameter calculation
The calculation methods in nPro were compared and validated with different hydraulic calculation tools. As an example, Tables 1 to 3 show a quantitative comparison of the pressure loss calculation in nPro and data from the pipe manufacturer ENERPIPE. The ENERPIPE data are based on a company brochure with data for a CaldoPEX pipe at 80 °C supply temperature and 60 °C return temperature (brochure: “ENERPIPE - Nahwärmetechnik die ankommt.”, 01/2021, pp. 34-35). Tables 4 to 7 present a quantitative comparison between the pressure loss calculations of nPro and the results of the online tool druckverlust.de. Tables 4 and 5 specifically validate the results for laminar flows and Tables 6 and 7 for turbulent flows.
| Inner diameter | nPro | ENERPIPE | Deviation |
|---|---|---|---|
| 90 mm | 300 Pa/m | 297.1 Pa/m | 1.0 % |
| 102.2 mm | 161 Pa/m | 158.8 Pa/m | 1.4 % |
| 114.6 mm | 92 Pa/m | 90.6 Pa/m | 1.5 % |
| Inner diameter | nPro | ENERPIPE | Deviation |
|---|---|---|---|
| 114.6 mm | 219 Pa/m | 217.3 Pa/m | 0.8 % |
| 130.8 mm | 115 Pa/m | 113.3 Pa/m | 1.5 % |
| Inner diameter | nPro | ENERPIPE | Deviation |
|---|---|---|---|
| 32.6 mm | 411 Pa/m | 403.6 Pa/m | 1.8 % |
| 40.8 mm | 139 Pa/m | 135.1 Pa/m | 2.9 % |
| 51.4 mm | 46 Pa/m | 44.1 Pa/m | 4.3 % |
| Inner diameter | Reynolds number | nPro | druckverlust.de | Abweichung |
|---|---|---|---|---|
| 21.7 mm | 1700 | 1.18 Pa/m | 1.25 Pa/m | 5.4 % |
| 27.3 mm | 1300 | 0.452 Pa/m | 0.447 Pa/m | 1.2 % |
| 50 mm | 1300 | 0.074 Pa/m | 0.075 Pa/m | 0.9 % |
| 100 mm | 2000 | 0.014 Pa/m | 0.013 Pa/m | 5.7 % |
| 170 mm | 300 | 0.00043 Pa/m | 0.000425 Pa/m | 1.1 % |
| Flow velocity | Power | nPro | druckverlust.de | Deviation |
|---|---|---|---|---|
| 0.0047 m/s | 0.49 kW | 0.044 Pa/m | 0.044 Pa/m | 0.0 % |
| 0.0083 m/s | 0.85 kW | 0.077 Pa/m | 0.077 Pa/m | 0.0 % |
| 0.014 m/s | 1.47 kW | 0.133 Pa/m | 0.133 Pa/m | 0.0 % |
| 0.02 m/s | 2.08 kW | 0.188 Pa/m | 0.188 Pa/m | 0.0 % |
| 0.023 m/s | 2.45 kW | 0.221 Pa/m | 0.211 Pa/m | 0.0 % |
| 0.027 m/s | 2.8 kW | 0.25 Pa/m | 0.255 Pa/m | 1.9 % |
| Flow velocity | Power | nPro | druckverlust.de | Deviation |
|---|---|---|---|---|
| 0.1 m/s | 16.1 kW | 3.52 Pa/m | 3.4 Pa/m | 3.5 % |
| 0.25 m/s | 40.4 kW | 19 Pa/m | 18.7 Pa/m | 0.7 % |
| 0.5 m/s | 80.6 kW | 70.2 Pa/m | 70 Pa/m | 0.3 % |
| 1 m/s | 161.1 kW | 269.3 Pa/m | 268 Pa/m | 0.5 % |
| 1.5 m/s | 241.6 kW | 596.9 Pa/m | 595 Pa/m | 0.3 % |
| 2 m/s | 322.1 kW | 1052.9 Pa/m | 1049.3 Pa/m | 0.3 % |
| Flow velocity | Power | nPro | druckverlust.de | Deviation |
|---|---|---|---|---|
| 0.1 m/s | 64.5 kW | 1.44 Pa/m | 1.4 Pa/m | 3.1 % |
| 0.25 m/s | 161.1 kW | 7.8 Pa/m | 7.7 Pa/m | 1.2 % |
| 0.5 m/s | 322.1 kW | 29.1 Pa/m | 28.9 Pa/m | 0.8 % |
| 1 m/s | 645.1 kW | 111.8 Pa/m | 111.6 Pa/m | 0.2 % |
| 1.5 m/s | 969.7 kW | 247.8 Pa/m | 248.6 Pa/m | 0.3 % |
| 2 m/s | 1290.2 kW | 437.18 Pa/m | 436.8 Pa/m | 0.1 % |