

The nPro potential analysis shows which heat sources and potentials are available in the vicinity of your district – from waste heat, wastewater treatment plants and water bodies through geothermal and solar thermal energy to biomass and renewable power generation.
Note: This module is currently only available for Germany.
What is the potential analysis used for?
Every district planning project starts with the question of which energy sources are actually available at the site. The potential analysis answers this question on a data basis and replaces time-consuming manual research across individual technical portals and geoportals. Typical applications are concepts for new-build and existing districts, municipal heat planning, and feasibility studies under Module 1 of the German federal funding scheme for efficient heat networks (BEW), which require available heat sources and potentials to be recorded and evaluated systematically.
How the analysis works
- Create your district in nPro.
- Define the analysis radius and start the potential analysis.
- Review the results for each data layer: occurrence, key figures such as area or capacity, and distance to the district boundary.
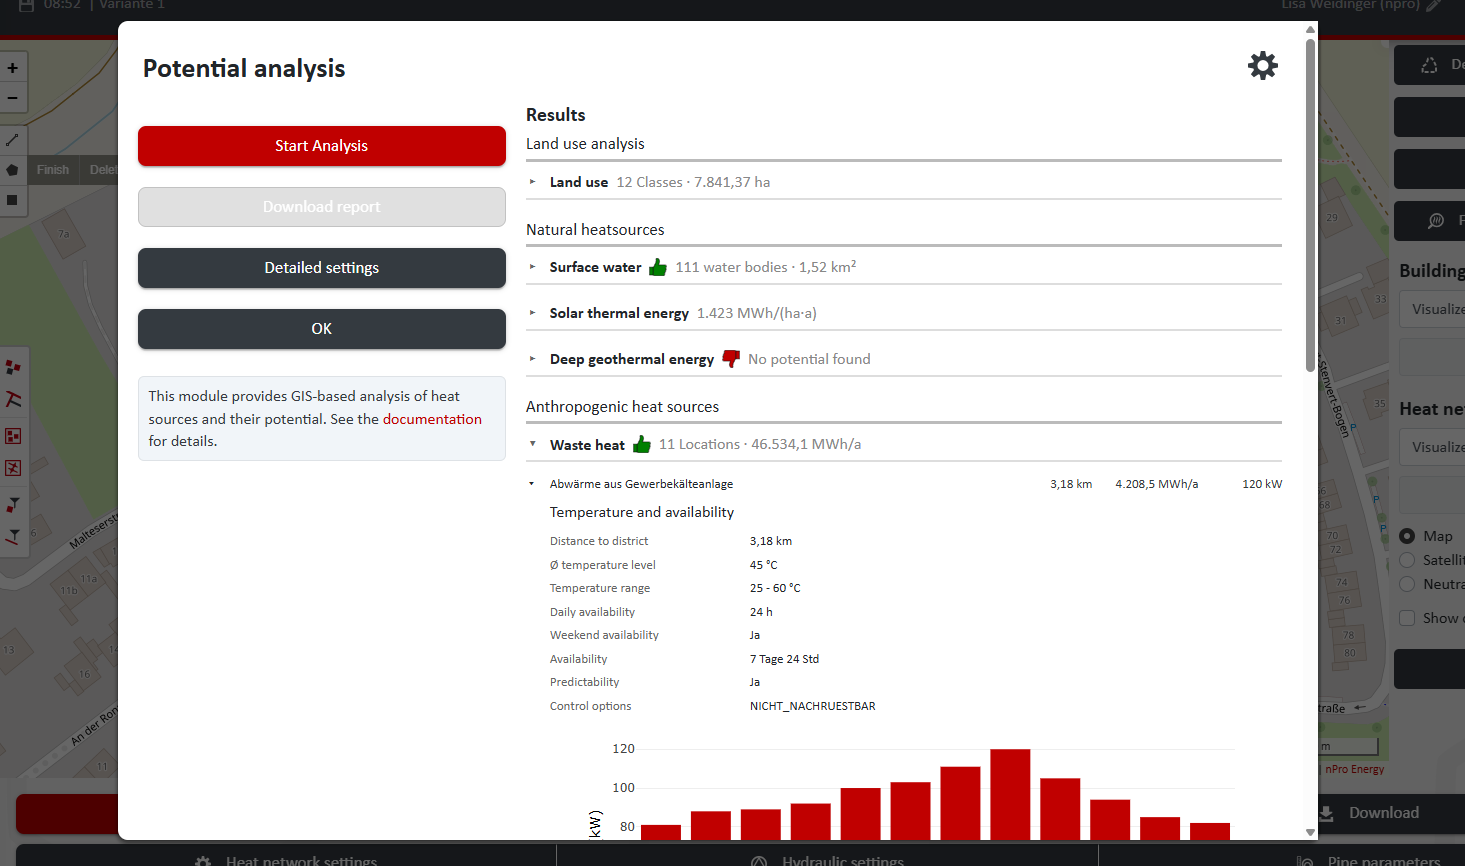
Anthropogenic heat sources
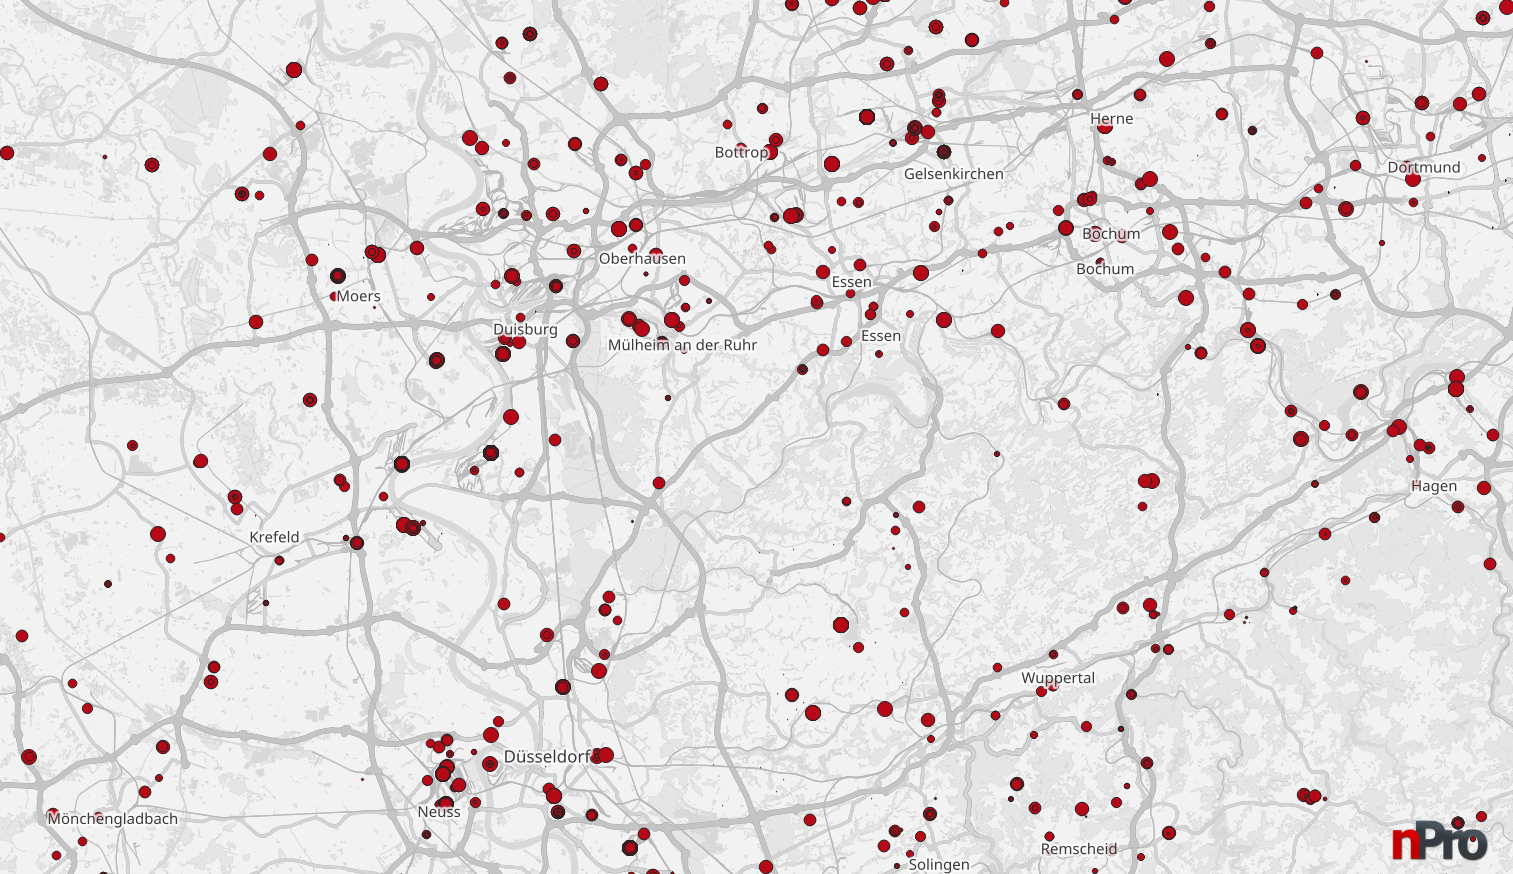
Waste heat from industry and commerce
The analysis checks whether waste heat sources are present within the analysis radius of the district. It evaluates the locations of industrial and commercial sites with waste heat potentials, along with their thermal capacity and load profiles.
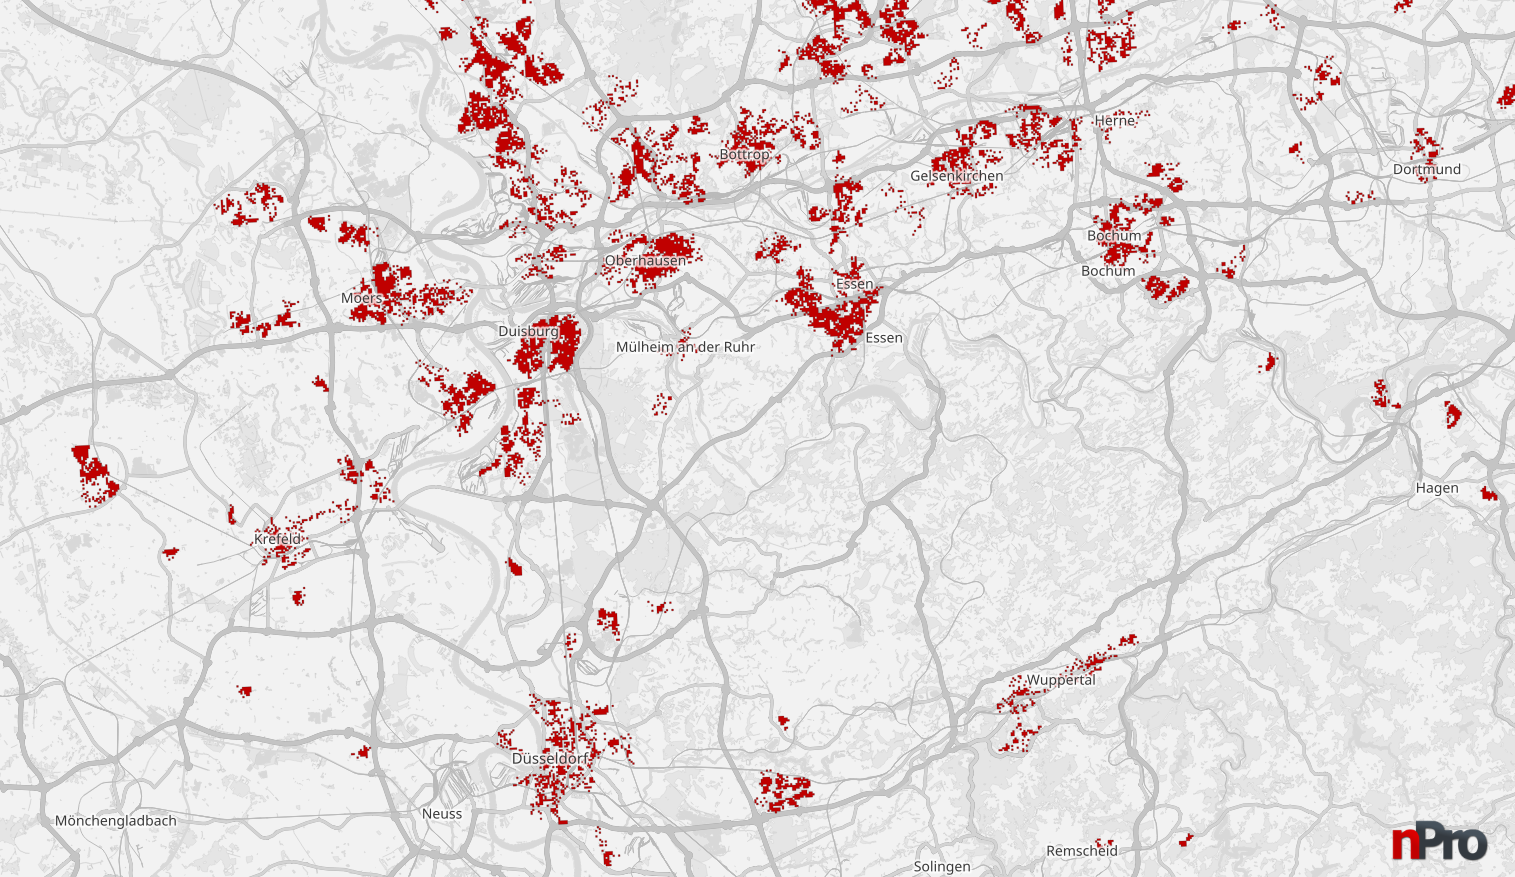
Existing heat networks
The analysis checks whether heat networks already exist in the vicinity of the district. Connecting to an existing network can be an economical and quickly implementable supply option, and may complement or replace the development of new heat sources.
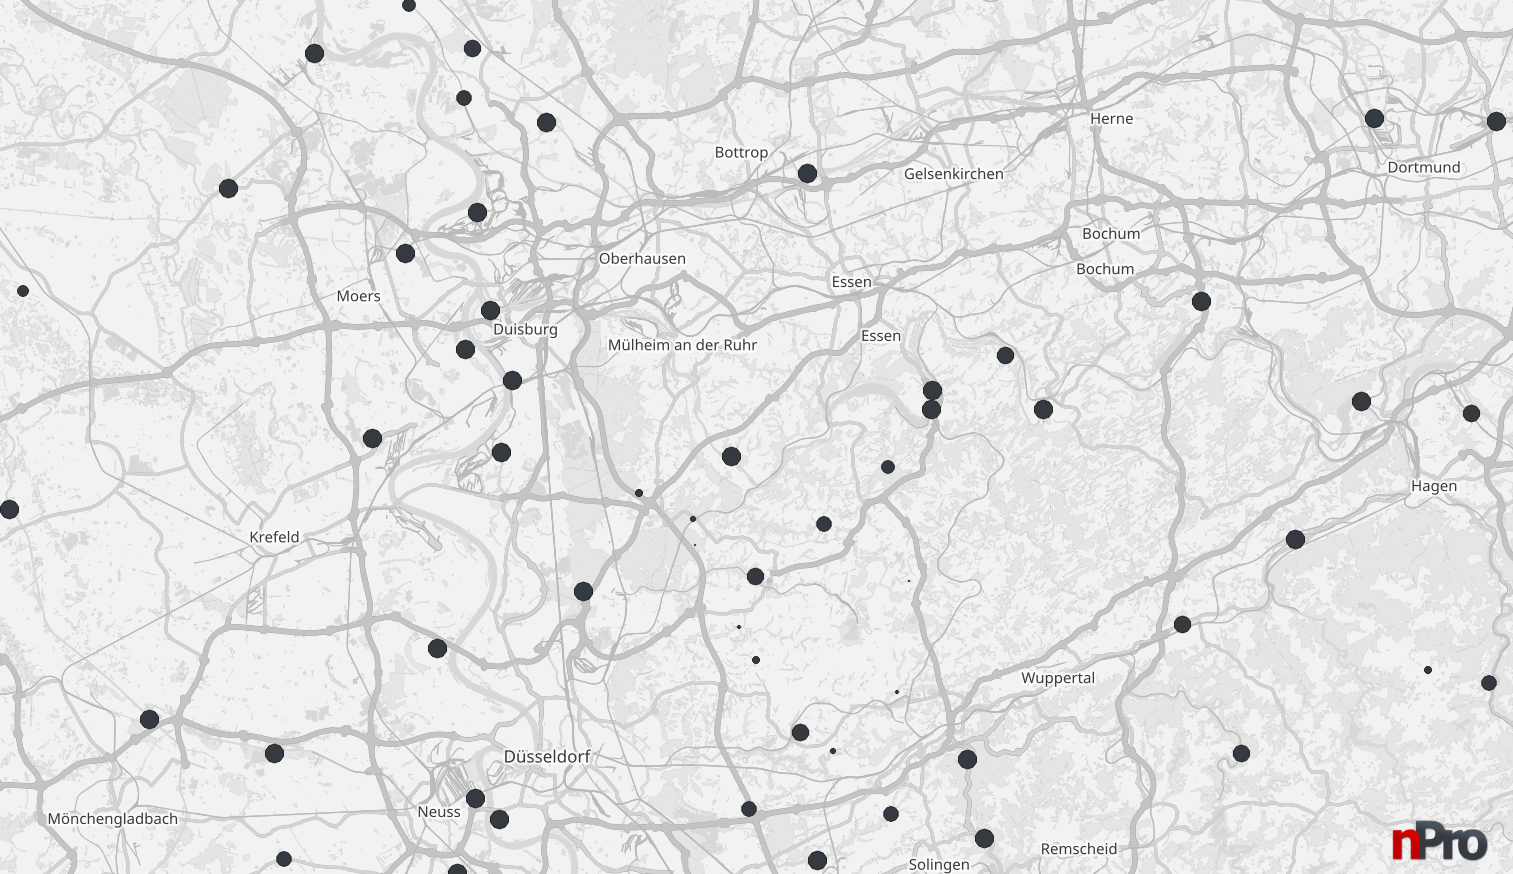
Wastewater treatment plants (wastewater heat)
Wastewater treatment plants continuously release heat via treated wastewater, which can be used with large-scale heat pumps. The analysis identifies treatment plants within the analysis radius and reports their design capacity (population equivalents) as well as the annual wastewater volume.
Natural heat sources
Surface waters
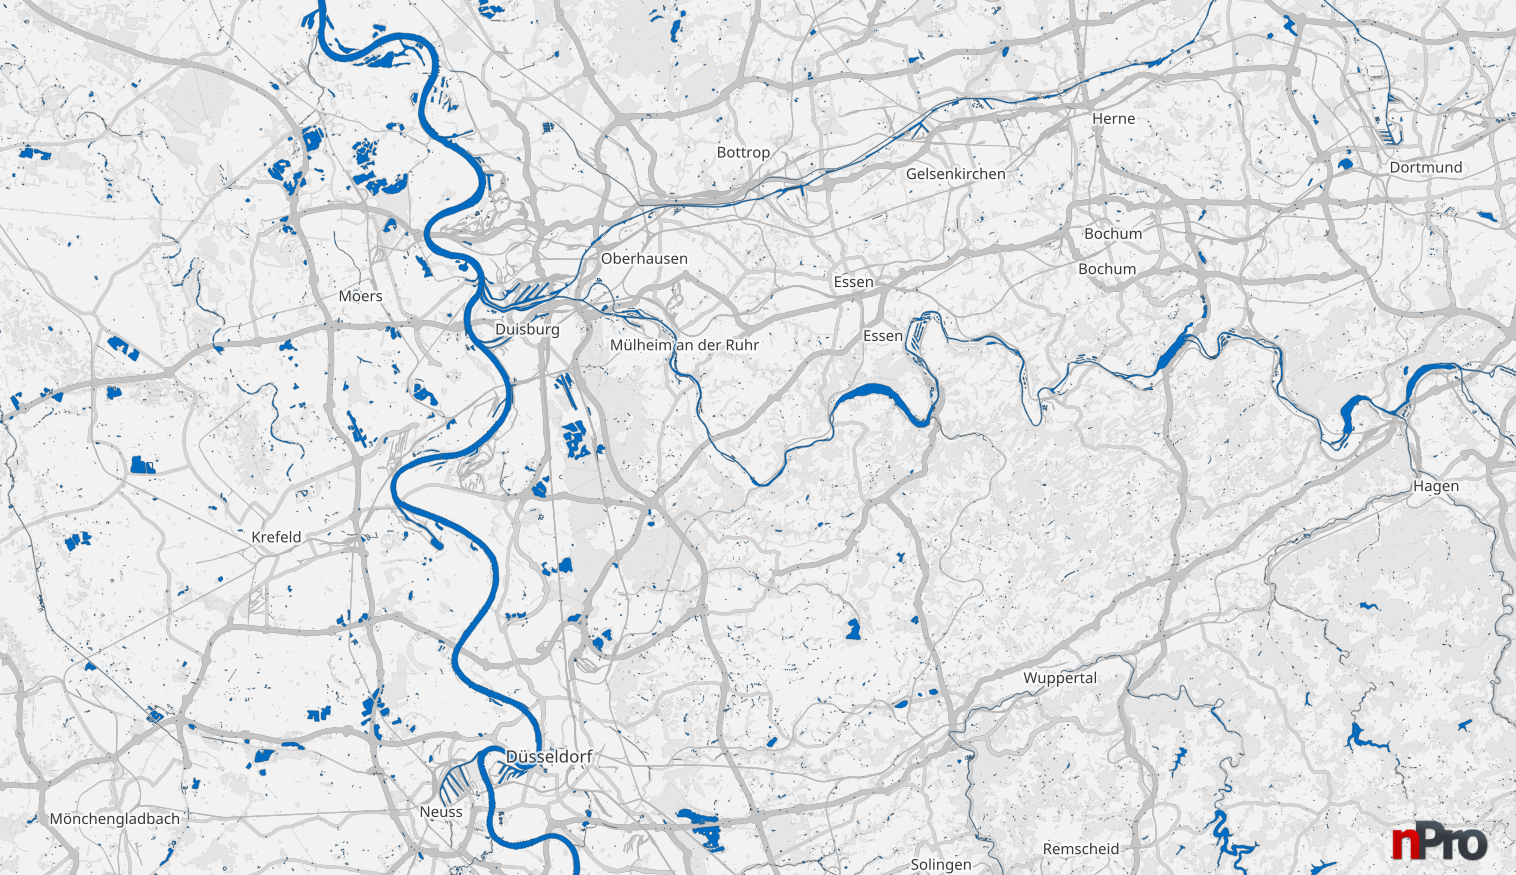
Rivers, lakes and other surface waters offer potential for climate-friendly heat supply via heat pumps. The analysis records water bodies within the analysis radius, including type, area and width (for watercourses). It also checks whether a water body lies within a water protection area.
Solar thermal energy
Solar thermal systems convert solar radiation directly into heat and can contribute both to domestic hot water preparation and to space heating support. The analysis evaluates the solar thermal potential based on site-specific solar radiation conditions. The yield is calculated for a standard flat-plate collector at three collector temperatures (50 °C, 70 °C and 90 °C) in order to represent different applications and temperature levels of the heat supply.
Shallow geothermal energy, deep geothermal energy and drinking water protection areas
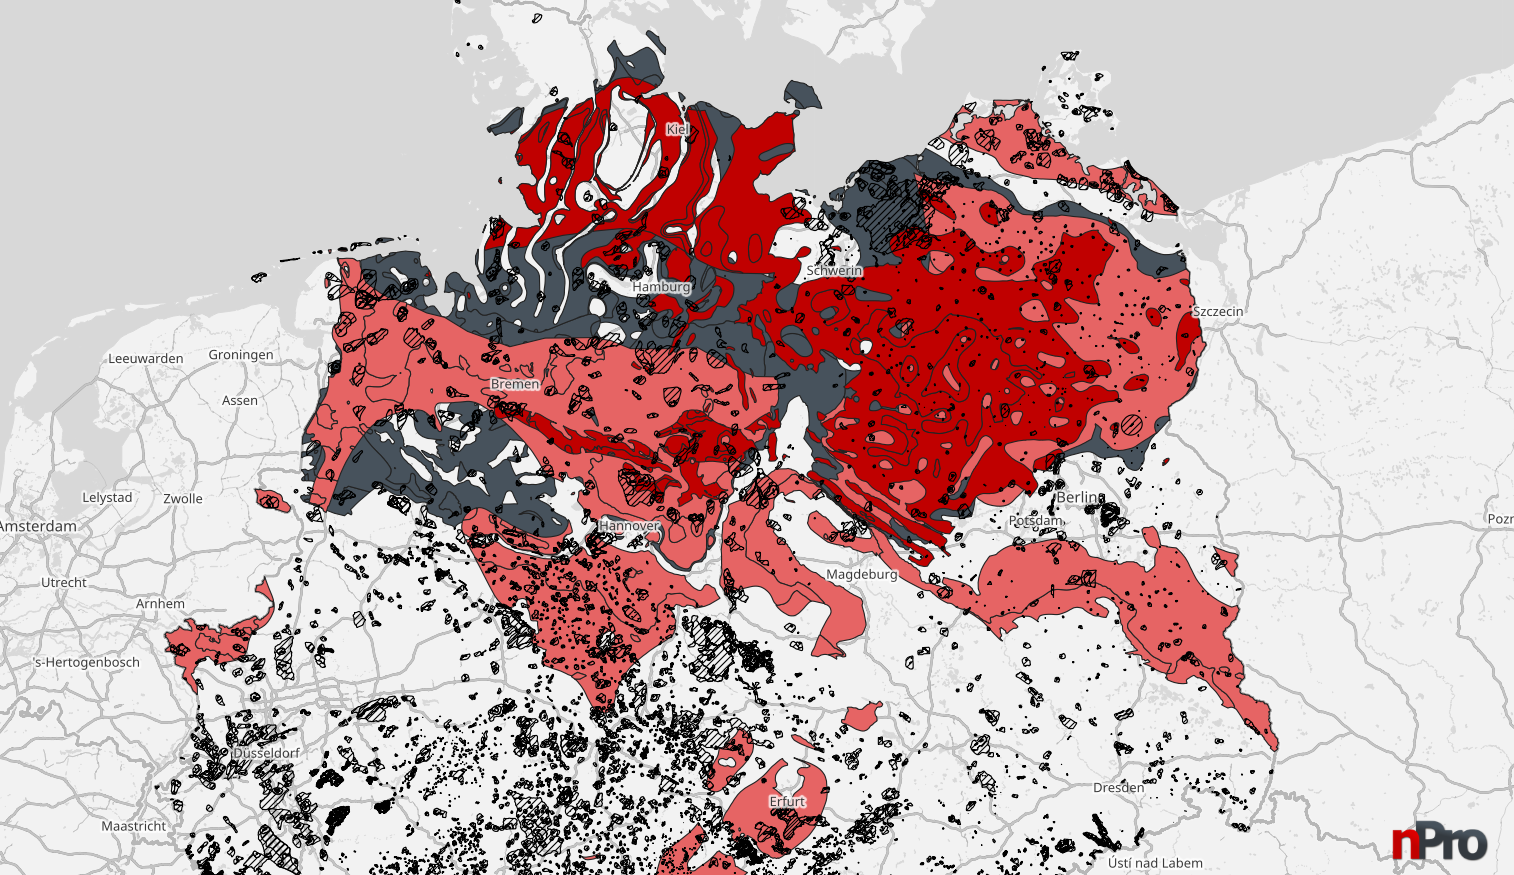
Shallow geothermal energy uses heat from the subsurface down to depths of around 400 m, where temperatures remain largely constant at about 8 to 12 °C throughout the year. Via heat pumps, this heat can be used both at building level and for heat networks. In summer, it can additionally be used for cooling and thus for regenerating the subsurface. The analysis examines the geological and hydrogeological conditions of the ground at the district location. Deep geothermal energy uses heat from deep rock layers and, depending on the geological conditions, can provide a weather-independent heat source suitable for base load. The analysis checks whether petrothermal or hydrothermal potentials (proven or assumed) are present at the district location and reports the expected temperatures. When analysing the geothermal potentials at the location, the position relative to water protection areas is also taken into account.
Renewable fuels
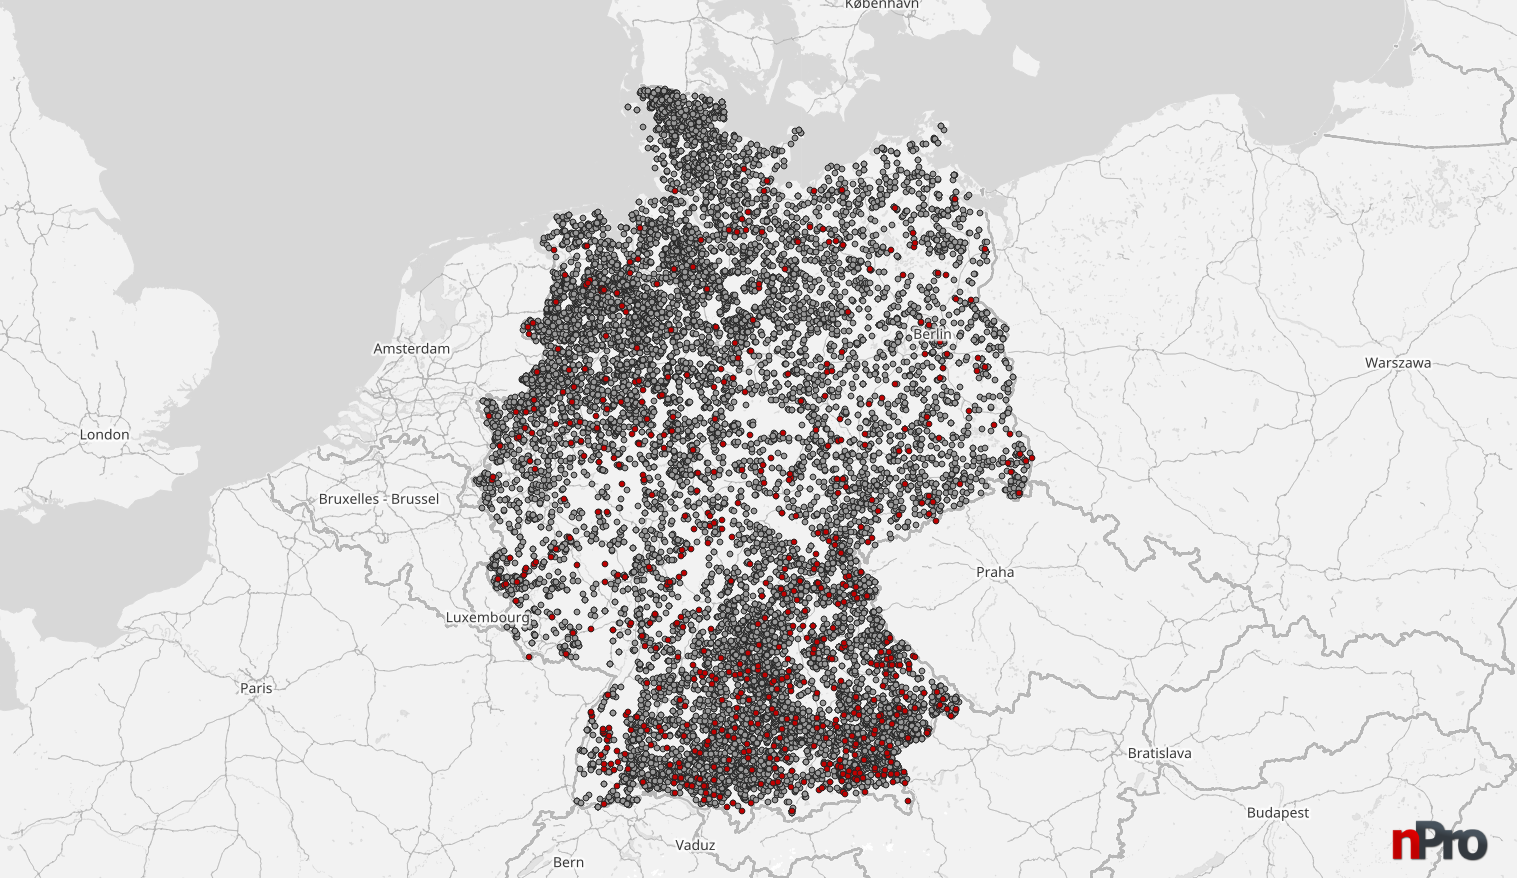
Biogas and solid biomass are storable, renewable fuels that can be used flexibly for heat and power generation. The analysis covers two aspects: existing biogas and biomass plants within the analysis radius, each with its distance to the district boundary, and the share of land suitable for biomass in the analysis area as an indication of local supply.
Renewable power generation
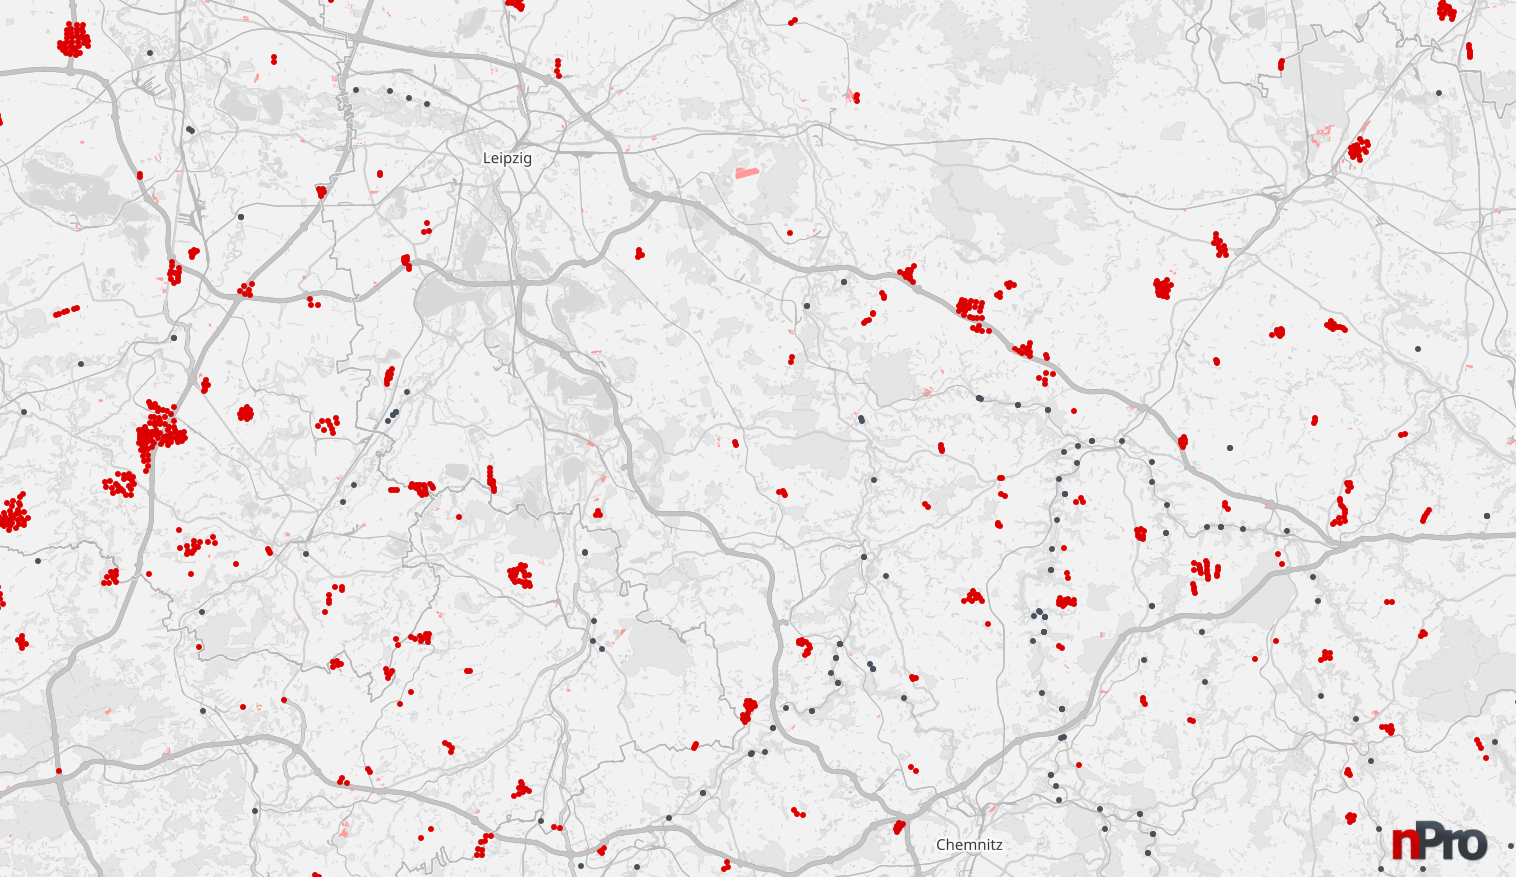
Renewable electricity from wind, photovoltaic and hydropower plants is a key element of decarbonization and can also contribute to climate-friendly heat supply through sector coupling, for example by operating heat pumps. The analysis records existing wind, photovoltaic and hydropower plants within the analysis radius and reports the installed capacity as well as the distance to the district boundary for each.
Data sources
The data is based on a combination of several official and open data sources. These are merged and harmonized into a single data model to ensure a consistent and reliable data basis.
| Potential | Source/dataset | Relevant data | Version | Reference |
|---|---|---|---|---|
| Waste heat | Federal Office for Economic Affairs and Export Control (BfEE): Waste heat platform | Location, address, annual heat quantity (kWh/a), max. thermal capacity (kW), temperature level, availability, monthly capacity profile (kW), supplementary information | 2022 | bfee-online.de |
| Existing heat networks | Federal Statistical Office (Destatis): 2022 Census, table “Buildings with residential space by predominant type of heating in grid cells” | Grid cells with district heating share | 2022 | destatis.de |
| Wastewater treatment plants | Kommunales Abwasser | Coordinates, name, design capacity, wastewater volume | 2022 | kommunales-abwasser.de |
| Surface waters | Geofabrik: Germany | Geometry, type, name | 2026 | download.geofabrik.de |
| Shallow geothermal energy | OpenGIS4ET Team, in citiwatts Wiki, Home page (August 2025) | Geometry, soil type, soil texture class (ESDAC), thermal conductivity, humidity class | 2021 | citiwatts.eu |
| Deep geothermal energy | Geothermal Information System (GeotIS), LIAG Institute for Applied Geophysics: Overview maps | Geometry, category (petrothermal/hydrothermal), temperature | 2013 | geotis.de1 |
| Solarthermal energy | Climate.OneBuilding.Org | Hourly values for solar radiation | 2026 | climate.onebuilding.org |
| Biogas, biomass, wind, PV and hydropower plants | Zenodo: Geo-locations and System Data of Renewable Energy Installations in Germany | Geometry, type, location, capacity, year of commissioning | 2021 | zenodo.org |
| Land use | CORINE Land Cover 2018 (vector/raster 100 m), Europe, 6-yearly | Category | 2018 | land.copernicus.eu2 |
| Water protection areas (Germany) | BfG geoportal: water protection area (Wasserschutzgebiete-DE) | Geometry, name | 2026 | geoportal.bafg.de3 |
| Water protection areas (Baden-Württemberg) | LUBW data and map service 4.0 | Geometry, name | 2026 | rips-datenlink.lubw.de4 |
Sources
- Data source: © LIAG Institute for Applied Geophysics. Reference citation: Agemar, T., Alten, J., Ganz, B., Kuder, J., Kühne, K., Schumacher, S. & Schulz, R. (2014): The Geothermal Information System for Germany – GeotIS. ZDGG 165(2), 129–144. Further references: geotis.de/homepage/references
- Generated using European Union’s Copernicus Land Monitoring Service information.
- © WasserBLIcK/BfG & competent authorities of the German federal states, 2026-04-02.
- Based on data from the Environmental Information System (UIS) of the LUBW Baden-Württemberg State Institute for the Environment.
Notes on data accuracy and suitability
The potentials reported are based on public and official data sources; coverage, timeliness and level of detail may vary by region. The analysis serves to pre-select possible heat sources and does not replace a site assessment, permitting procedure or feasibility study. No warranty is given as to accuracy, completeness or fitness for a particular purpose.
Potential analysis for your district
The potential analysis is part of the Plus license and can be run directly for any project in nPro.