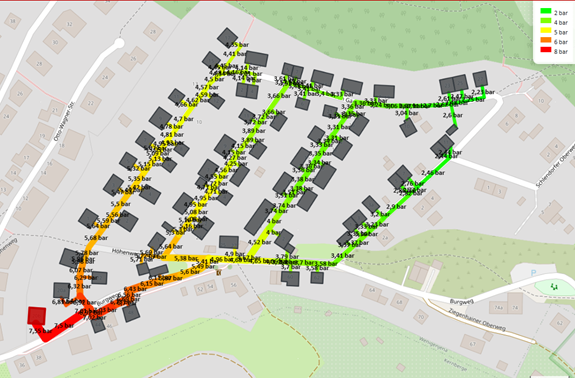
The nPro tool calculates the absolute pressures in the supply and return lines of a heating network based on pipe pressure losses, geodetic height differences and pressure losses at substations and fittings. nPro checks whether there is sufficient pressure throughout the network to avoid cavitation and to comply with the hydraulic boundary conditions.
Calculation Principle
The starting point of the calculation is the pressure maintenance at the energy hub, whose setpoint is specified in the hydraulic settings. Based on this, nPro calculates the pressures at all nodes in the supply and return lines. The calculation takes into account the pressure losses in the pipes, the pressure losses at substations, fittings and the energy hub, as well as the geodetic height differences in the network. This works for branched networks as well as for meshed networks.
Pressure Components Considered in Network Simulation
Pipe Pressure Losses
The pressure losses in the pipes are determined from the volume flows and the nominal diameters calculated during sizing.
Geodetic Pressure Differences
Height differences in the network lead to static pressure changes. These are calculated using the hydrostatic equation:
where is the density of the fluid, is the gravitational acceleration and is the height difference between two points in the network. The pressure difference between two points can accordingly be written as:
Neglecting Dynamic Pressure
The dynamic pressure component is neglected in the pressure calculation, since in heating networks it is generally very small compared to static pressure differences due to height differences and pipe friction losses. Dynamic pressure results from the flow velocity of the fluid and is generally given by:
Minimum Pressure and Safety Margins
For safe operation of the heating network, the pressure throughout the network must remain above the vapor pressure of the heat transfer medium. If the pressure locally falls below the vapor pressure, vapor bubbles can form (cavitation), which can lead to unstable operation and damage to system components. High points in the network are particularly critical, as the static pressure is lowest there due to the geodetic height differences. It is therefore checked whether the minimum pressure in the network exceeds a defined safety limit. The minimum pressure requirement results from the vapor pressure of the heat transfer medium at the maximum network temperature plus additional safety margins:
Here, denotes the vapor pressure of the heat transfer medium at the maximum network temperature . The following safety margins are taken into account:
- bar: safety margin at the highest point of the network to avoid cavitation
- bar: general safety margin to account for operational and model uncertainties
Calculation of Vapor Pressure (Antoine Equation)
The vapor pressure of the heat transfer medium is calculated as a function of temperature using the Antoine equation. It describes the relationship between temperature and the saturation vapor pressure of a substance and is commonly used to determine the vapor pressure of water.
where is the temperature in °C and , and are substance-specific Antoine coefficients. The equation initially yields the vapor pressure in mmHg, which is then converted to pascals:
The following coefficient ranges are used for water:
| Temperature range | A | B | C |
|---|---|---|---|
| 1 – 100 °C | 8.07131 | 1730.63 | 233.426 |
| 100 – 374 °C | 8.14019 | 1810.94 | 244.485 |
Data Source for Elevation Data
The geodetic heights of the network components are automatically derived from digital elevation models (DEM). Copernicus DEM-90 elevation data is used as the data basis, offering near-global coverage with a spatial resolution of approximately 90 m. These datasets enable a consistent and automated determination of the terrain topography across the entire network area. During the calculation, the data is automatically applied to pipes whose geodetic height has not yet been defined or is set to 0 m.
| Region | Latitude (°N) | Longitude (°E) | Resolution |
|---|---|---|---|
| Central Europe | 43.0 – 58.0 | −9.4 – 25.0 | 90 m |
| Scandinavia | 53.4 – 71.6 | 4.0 – 42.1 | 90 m |
| Northeastern USA | 36.5 – 47.5 | −89.9 – −69.8 | 90 m |
| US West Coast | 32.1 – 50.0 | −124.8 – −114.5 | 90 m |
| Chile & Western Argentina | −56.1 – −22.7 | −76.0 – −64.5 | 90 m |
| Eastern China & Korea | 24.0 – 41.0 | 109.9 – 130.1 | 90 m |
| Southern Europe (Mediterranean) | 34.5 – 44.0 | −10.0 – 30.9 | 90 m |
Further regions will be added in the future and can also be integrated into the terrain database on request. For regions not currently covered, a terrain height of 0 m is assumed in the pressure calculation.
Calculation and Visualization of Pressure Profiles in nPro
Hydraulic Settings
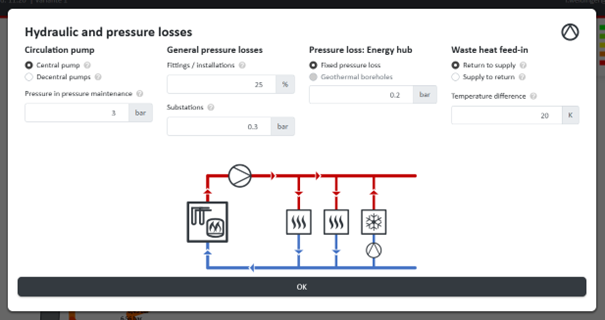
The hydraulic settings allow the hydraulic boundary conditions of the heating network to be adjusted for each project. You can choose between a central circulation pump and decentralized pumps at the building substations (passive 5GDHC networks). The setpoint of the pressure maintenance, referring to the return line at the energy hub, can be set individually. In addition, the pressure losses of fittings, substations and the energy hub can be configured separately in order to represent the hydraulic conditions of the network as realistically as possible.
Visualization of Geodetic Heights
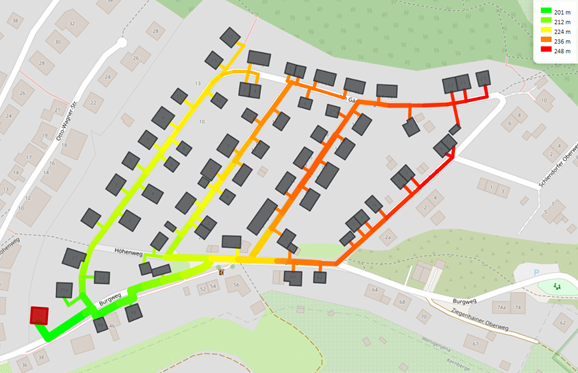
The height profile of the heating network pipes can be displayed in the network visualization.
Visualization of Pressure Profiles
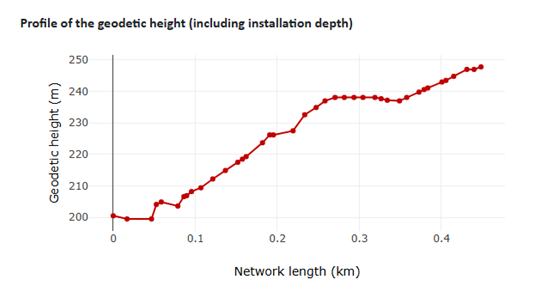
To analyze the hydraulic conditions, the pressure profiles are displayed along the hydraulically least favorable path in the network (pipes from the energy hub to the critical network point). Both the pressures without geodetic height differences and the total pressures including topography are shown.
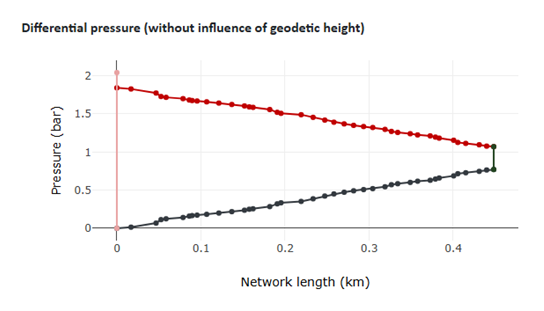
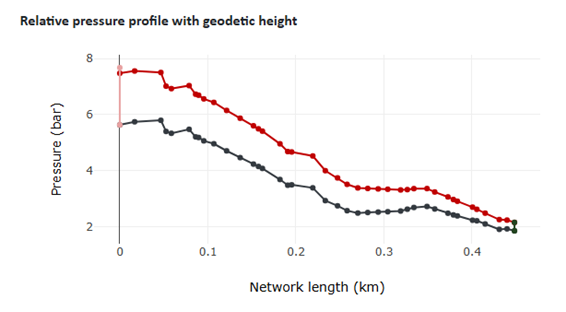
In addition, the absolute pressures of the pipes can be visualized on the map to analyze the pressure profiles throughout the network.