Case study: Heating and cooling supply of a district with hydrogen
This case study examines a district partially supplied with a heating and cooling network using hydrogen technologies. The entire planning process can be carried out in the nPro tool: from demand calculation to pipe sizing and designing heating and cooling generators in the energy hub.
District
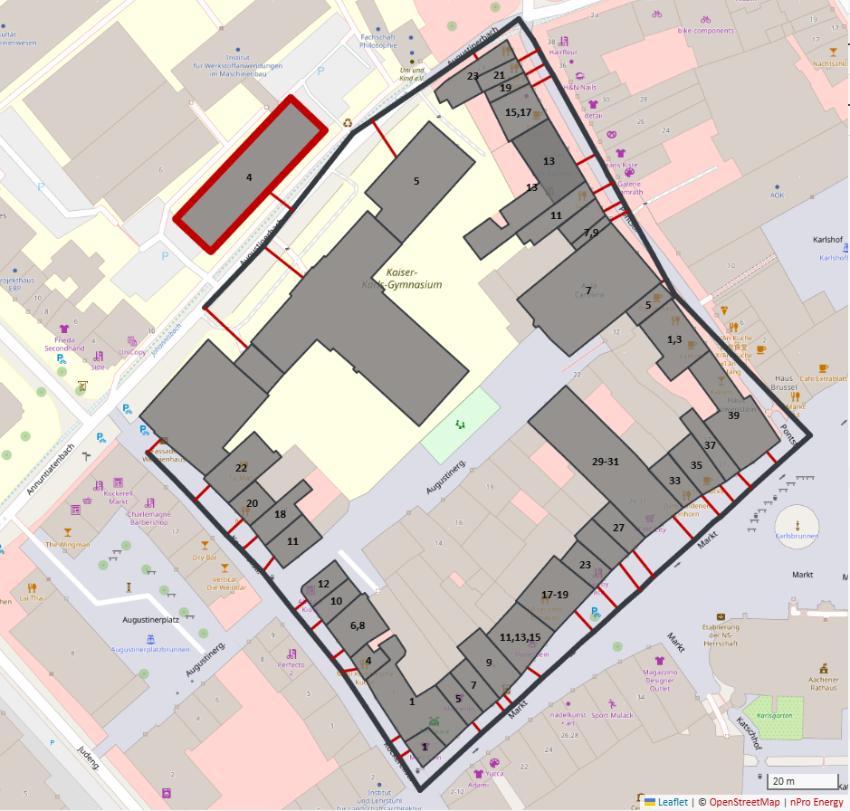
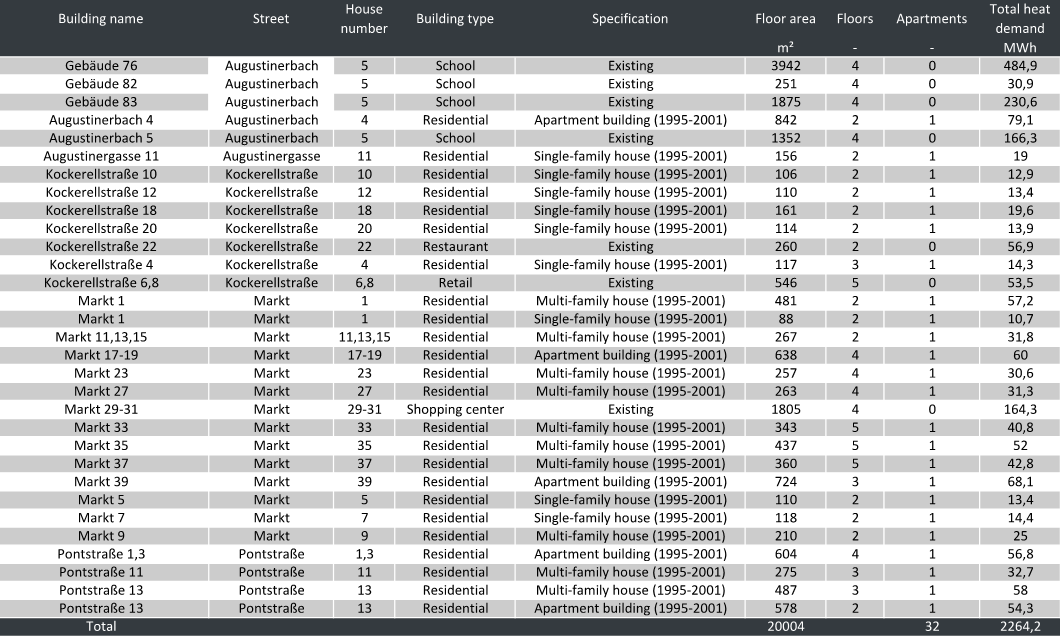
An energy supply system is planned for a model district with 39 buildings. The district includes a school and several mixed-use residential buildings with retail. The district is assumed to be located in Aachen, Germany.
Step 1: Demand analysis for heating, cooling and electricity
- Building Standard:
- Existing (1900-1990)
- Heat source/energy hub:
- Existing district heating network
- Waste heat from a hydrogen electrolyzer
- Space heating and domestic hot water demand:
- Local district heating network
- Cooling demand:
- Covered by space cooling and process cooling (e.g., server cooling) via a separate district cooling network (4-pipe system)
- Electricity demand:
- General demand for user electricity (e.g., lighting)
- Demand for e-mobility
With just a few clicks, demand profiles for each of the 39 buildings can be created in nPro. Annual profiles with hourly resolution are crucial for the district calculation, as renewable sources (here photovoltaics) depend on time and season.
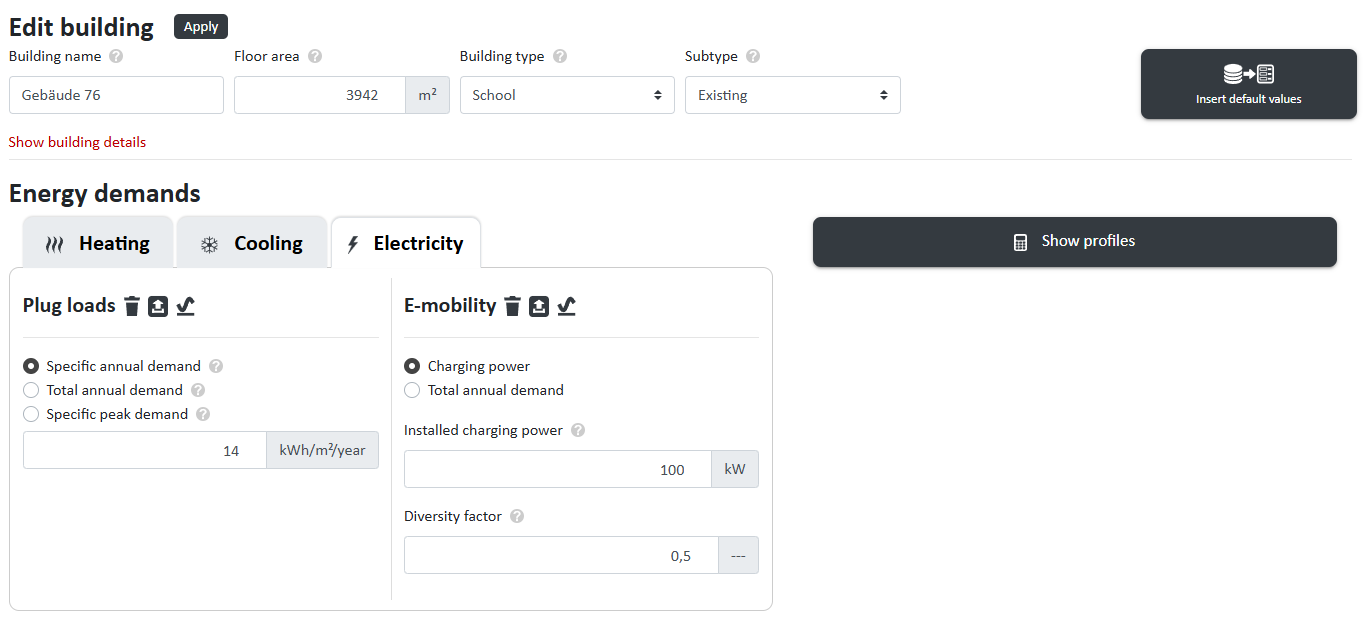
In nPro, various heating, cooling, and electricity demands can be individually defined for each building, including user electricity, e-mobility, or air conditioning for server rooms, for example.
Step 2: Load profiles at the energy hub
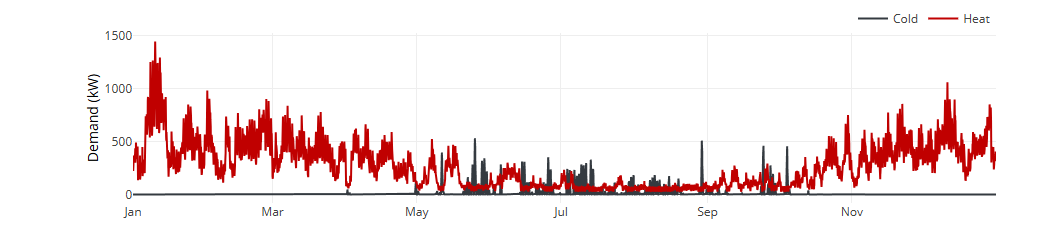
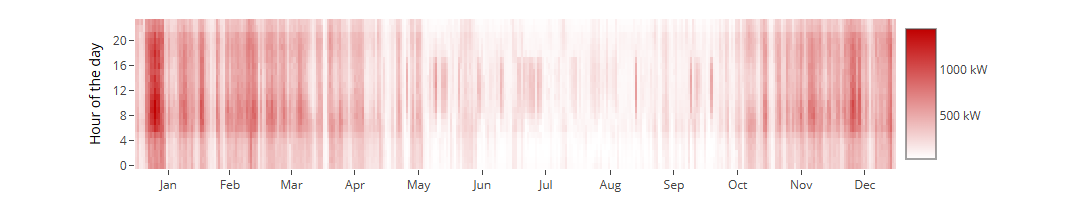
After adding all buildings to the district, the load profiles can be displayed in hourly resolution in nPro. Figures 3 and 4 illustrate the annual profiles of heating and cooling supply at the energy hub. These include the energy demands of the buildings, the heat losses of the pipes and the simultaneity factors of the network.
Step 3: Pipe dimensioning
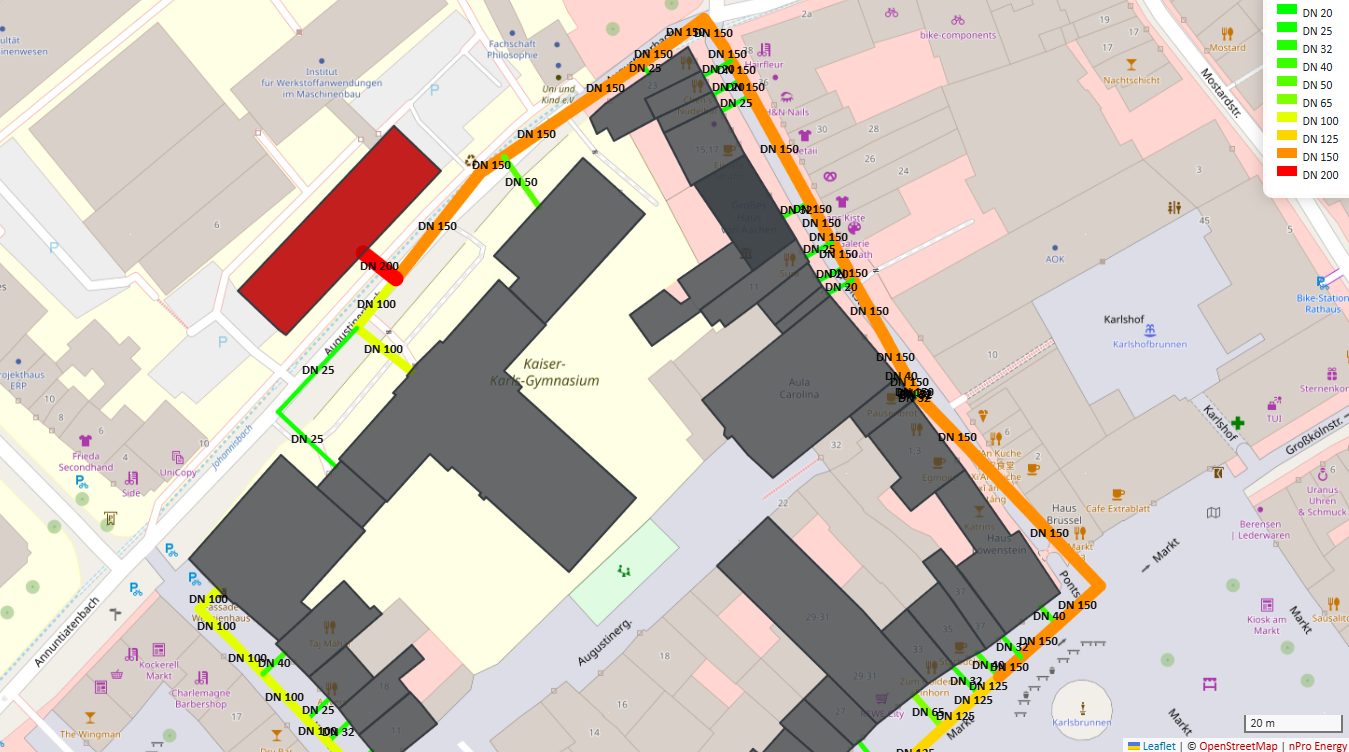
In nPro, the diameters of pipes for district heating networks can be automatically sized and visualized on a map. The result of the network design is shown in Figure 5.
Step 4: Design of the energy hub
In the given district, heating, cooling, and electricity supply will be provided using hydrogen technologies.
The design assumes a 3-MW-connection to an existing district heating network. The remaining heat is to be provided through an electrolysis process.
The installed electrolyzer generates hydrogen from surplus PV electricity, which is fed into the gas grid. The resulting waste heat is fed into the heating network.
The PV electricity generation is shown in Figure 6.
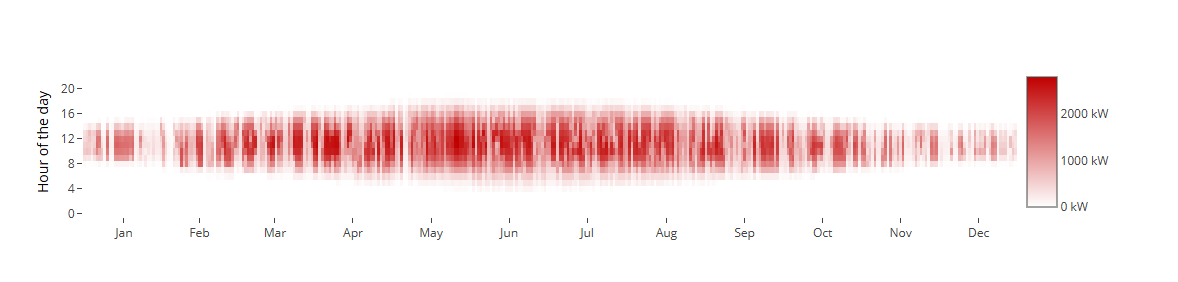
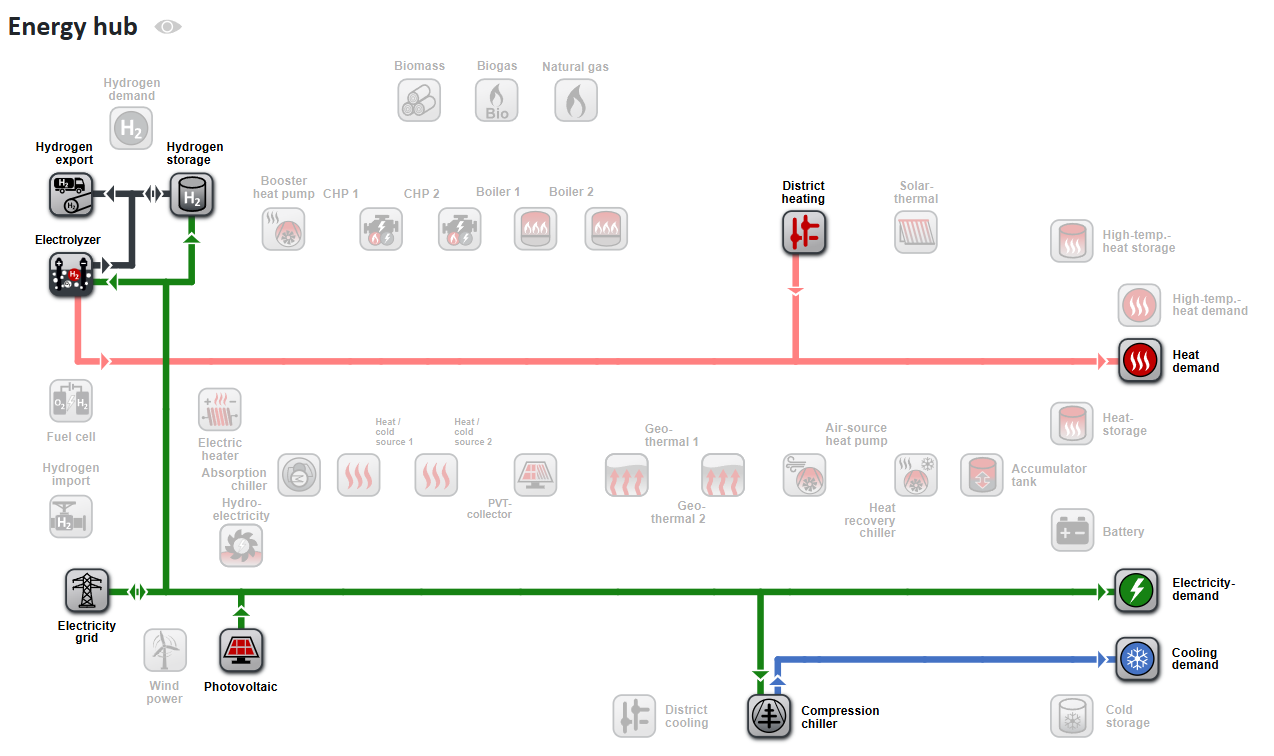
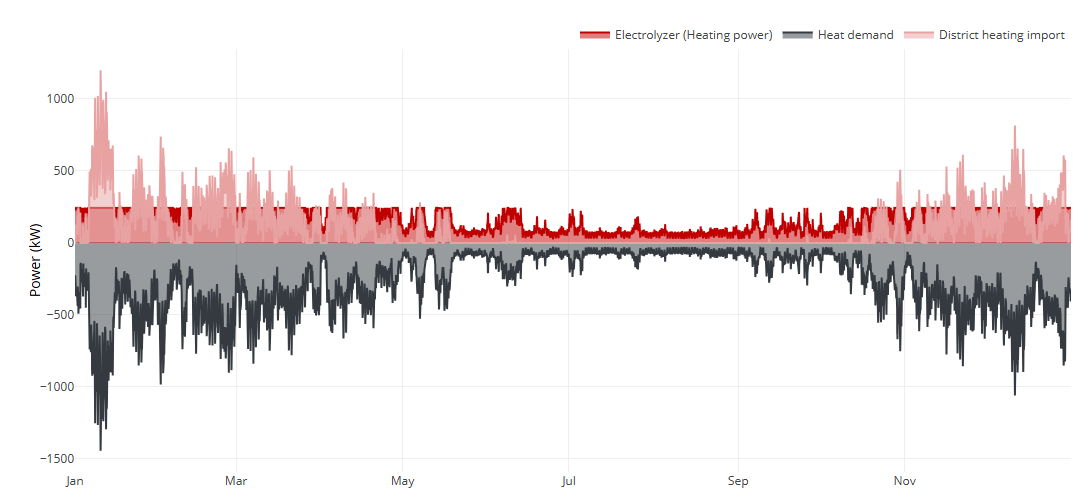
Figure 7 illustrates the operation of the nPro-optimized energy supply system.
The cooling loads are covered by compression chillers.
The district’s electricity supply comprises 62.4 % from the power grid
and 37.6 % from renewable electricity generation, exclusively from photovoltaics (PV). The installed PV system, with a collector area of 21,671 m²,
covers 33 % of the district’s energy demand autonomously, with 81.8 % of the generated electricity being used on-site.
The heat supply is covered 62.5 % by the electrolysis process and 37.5 % through district heating. District heating has a specific CO2 emissions factor of 150 g/kWh.
The cooling loads of the district are entirely covered by compression chillers, with an annual energy demand of 152 MWh.
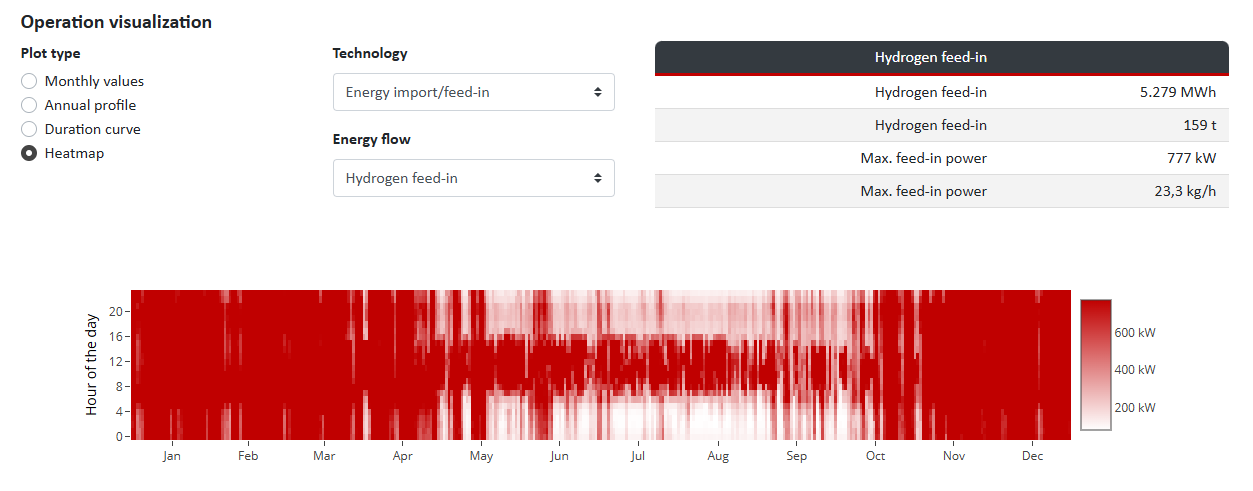
A key component of the system is hydrogen feed-in, which utilizes surplus PV electricity. Here, 5,279 MWh of hydrogen (159 tons) with a maximum feed-in capacity of 777 kW are fed into the gas grid each year.
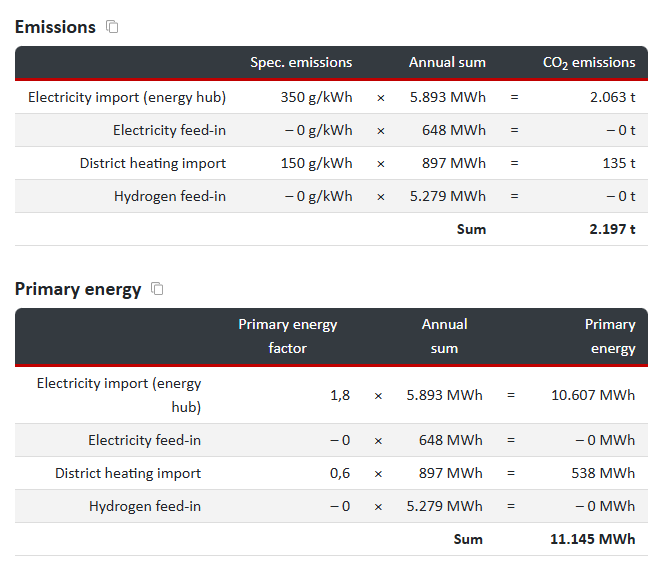
The primary energy demand amounts to 11,145 MWh, with the majority (10,607 MWh) coming from grid electricity.
The CO2 emissions for the district are 2,197 t per year, with 2,063 t from grid electricity and 135 t from district heating. Hydrogen production is emission-free. Using nPro, specific emissions targets can be defined and the energy system optimized accordingly.
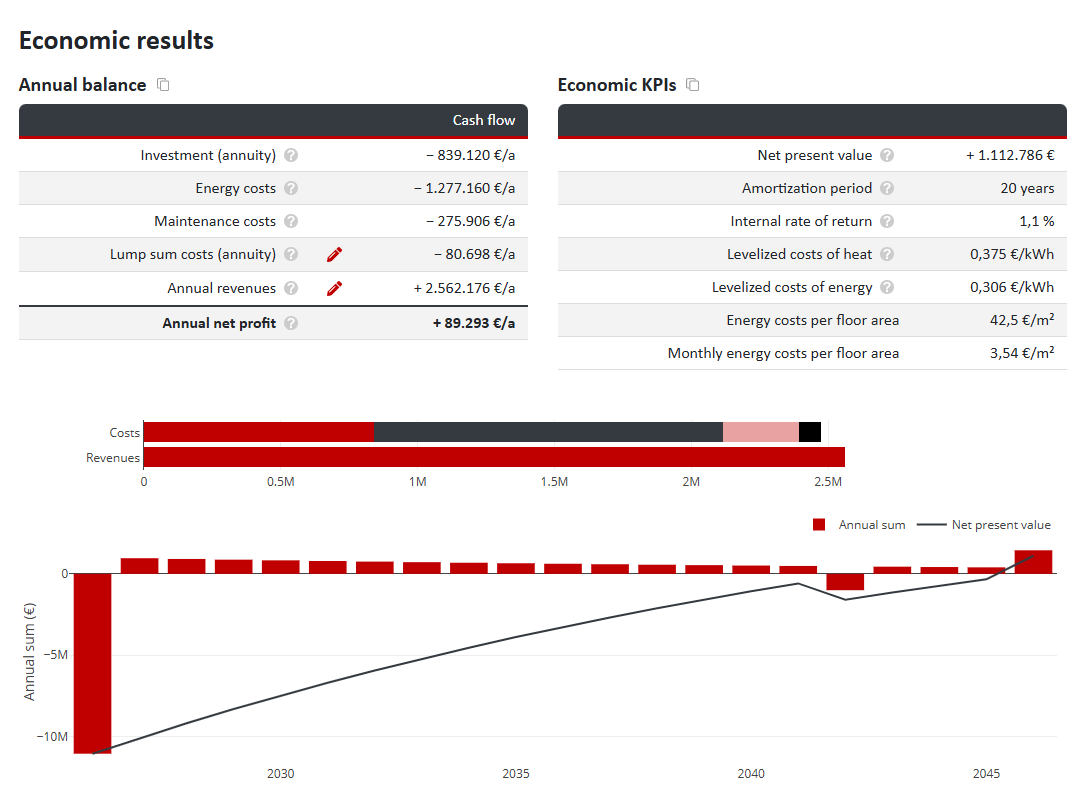
Step 5: Economic analysis
The annual cash flow balance and various economic key figures can be calculated and visualized in nPro. For this, nPro uses the discounted cash flow method. These include the payback period, the net present value, the internal rate of return, and the levelized cost of heat. This enables decision-makers to transparently evaluate the economic feasibility of the energy system.
Video tutorial on hydrogen energy systems
A detailed video tutorial on calculating a hydrogen energy system (with an old version 1.0 of nPro) can be found here:
 English
 Deutsch


