Functionality of the nPro Tool
An overview of the functionality of the nPro tool can be found on this overview page.
Table of Contents
Key Benefits
nPro is a modular, flexible software tool that simplifies and accelerates the traditional, manual planning of districts. It was specifically developed for the early planning phase, where only limited information about a district and energy system is available. The key benefits of the tool are:
- User-friendly and intuitive interface
- Excel export functions for all calculation results
- Time series export as Excel file, CSV, TXT, or Modelica format
- nPro is modular: nPro is not a large monolithic tool, meaning it can be used as flexibly as required for planning complex energy systems. All intermediate results can be exported for custom calculations, and only the input values actually required for the calculation are requested.
- User-friendly import of time series: Time series can be easily imported via copy & paste from Excel. Additionally, custom time series can be manually created with just a few clicks.
- Share projects with other users: In district projects, oversized Excel files with various planning versions are often exchanged among project partners. There is an easier way: Share the current project status easily and conveniently with other project partners in nPro and collaborate on the latest planning version.
- Multi-modal systems require dynamic profiles: The commonly used static sizing methods fall short for systems with renewable energies. For instance, calculating the self-consumption of renewable energy requires time series with hourly resolution for an entire year. For this reason, all calculation steps in nPro are based on a hourly resolution with 8,760 time steps.
1) Create a Project
If you have already created a project and stored specific parameters (e.g., costs for CHP, pipe network, or heat pump data sheets) in nPro, you can download/export these parameters as a bundled dataset in a file. For new projects, this dataset with all parameters can be easily uploaded and reused via the button.
Project Type
With just a few clicks, you can create a new project in nPro. The following options are available as project types:
- District (multiple buildings, a heating network, an energy hub)
- Single building
- Energy hub (use your own load profiles)
Weather Data
Weather data can be selected from an extensive list of cities or custom weather data (time series or .epw files) can be uploaded to match the project location. These data later serve as the basis for the nPro software in simulating the optimal energy system, for example, by incorporating solar thermal energy. The stored weather data can also be visualized, manually modified, or exported.
Project Template
You can save significant time by selecting the appropriate project template from the following options right from the start:
- For heat supply:
- Heating network (> 60 °C)
- LowEx heating network (35–60 °C) with decentralized domestic hot water post-heating
- Fifth generation district heating and cooling network (0–35 °C, anergy network)
- Decentralized air/ground-source heat pumps (no heating network)
- Microgrid (electricity-based system, no heating network)
- For cooling supply:
- No cooling demand
- Decentralized cooling machines (ground-source, air)
- Cooling network (6/12 °C, 4-pipe system)
This preselection directly assigns the appropriate parameter dataset to your project at the start. However, all parameters can be modified at any time later.
Using the button, further configurations can be made, such as whether holidays or daylight saving time should be considered when creating demand profiles.
With these presettings completed, the new project can be created.
2) Map Display and District Setup
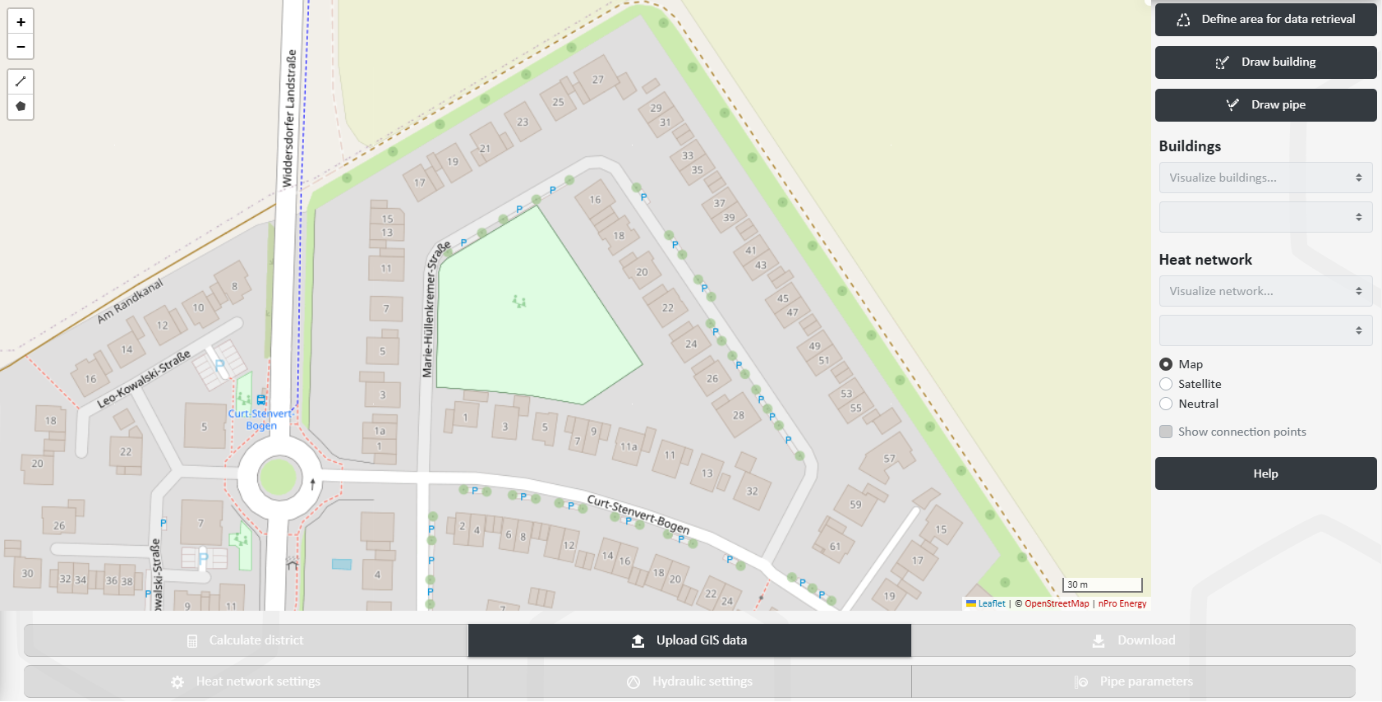
In the newly created project, you can first zoom in on the interactive map to the project location. The OpenStreetMap representation in nPro ({filename='static/tool-map-view-heat-network-planning-map.png'}) enables an intuitive visualization of the district. This allows for easy configuration and analysis of buildings, heating networks, heat sources, and network connections. The evaluation of optimization options in the context of planned network expansion or the integration of renewable energy sources is significantly simplified in this way.
Draw District
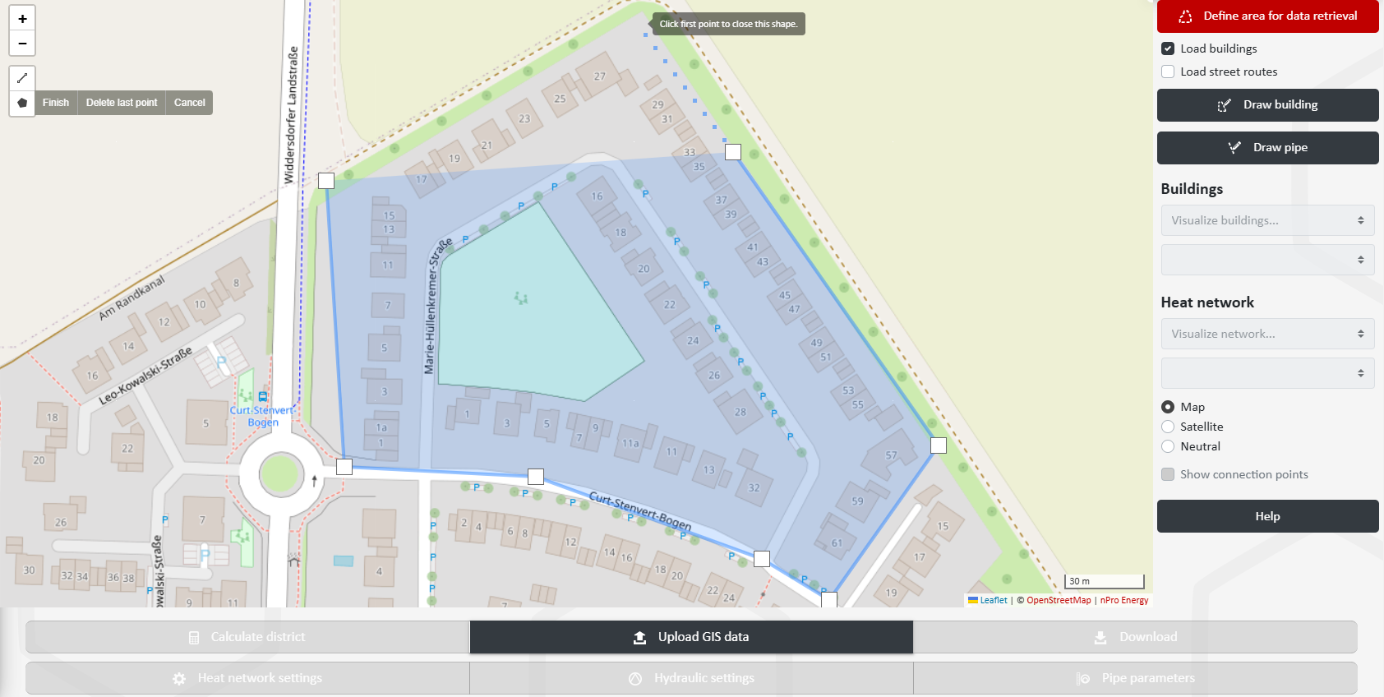
Using ({filename='static/tool-map-view-heat-network-planning-building-data.png'}), the district can be manually drawn.
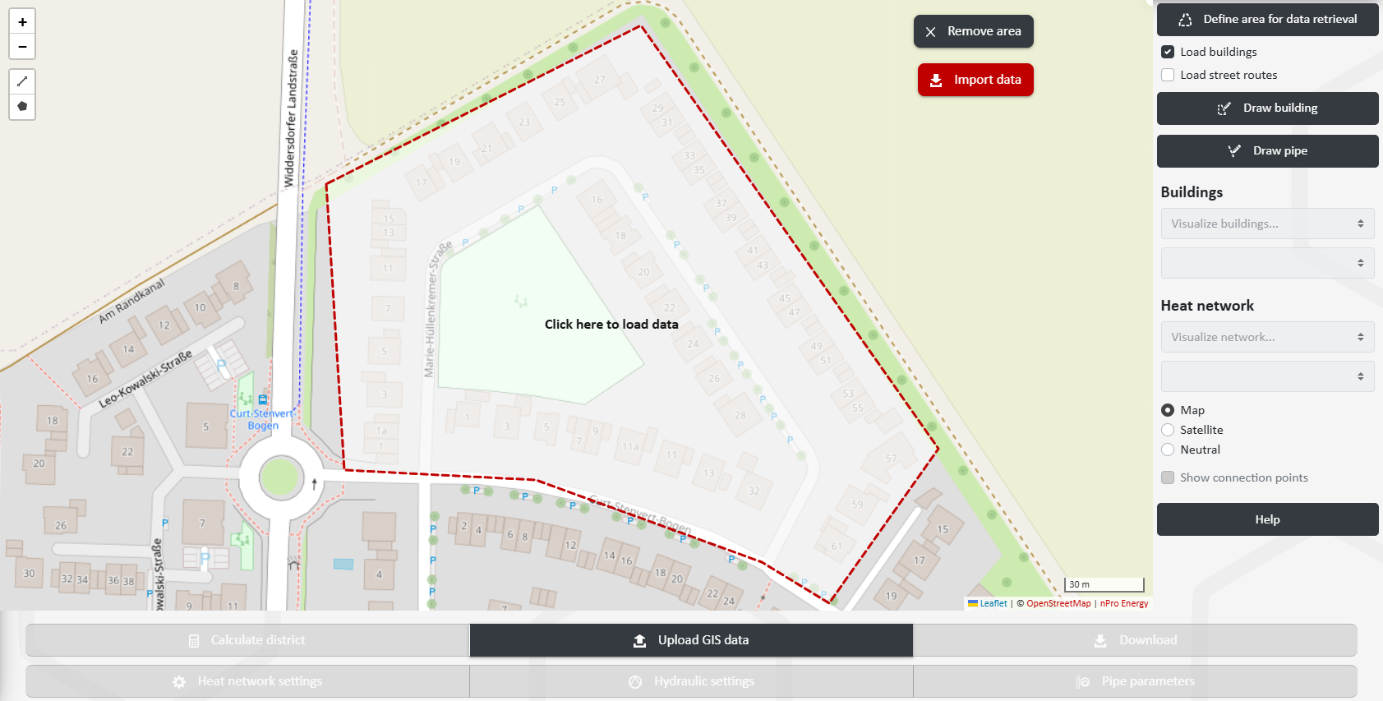
For the drawn district, the building data stored in nPro is now retrieved ({filename='static/tool-map-view-heat-network-planning-retrieve-building-data.png'}), including building outlines and some basic building data.
Draw Pipes
Similar to defining the district area, the main and branch pipelines can also be manually drawn on the map ({filename='static/tool-map-view-heat-network-planning-draw-pipe.png'}).
Set Up Heating Network
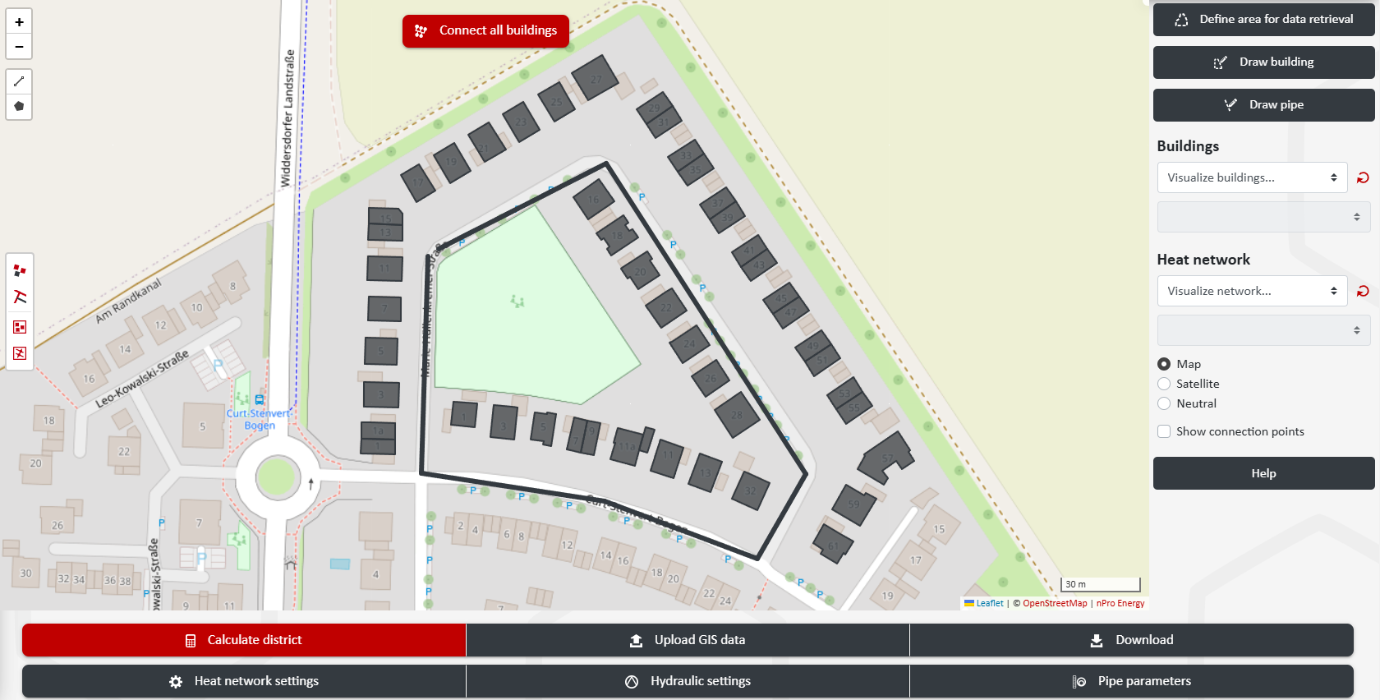
Using the buttons or ({filename='static/tool-map-view-heat-network-planning-connect-building.png'}), individual or all selected buildings can be connected to the drawn pipeline route at once.
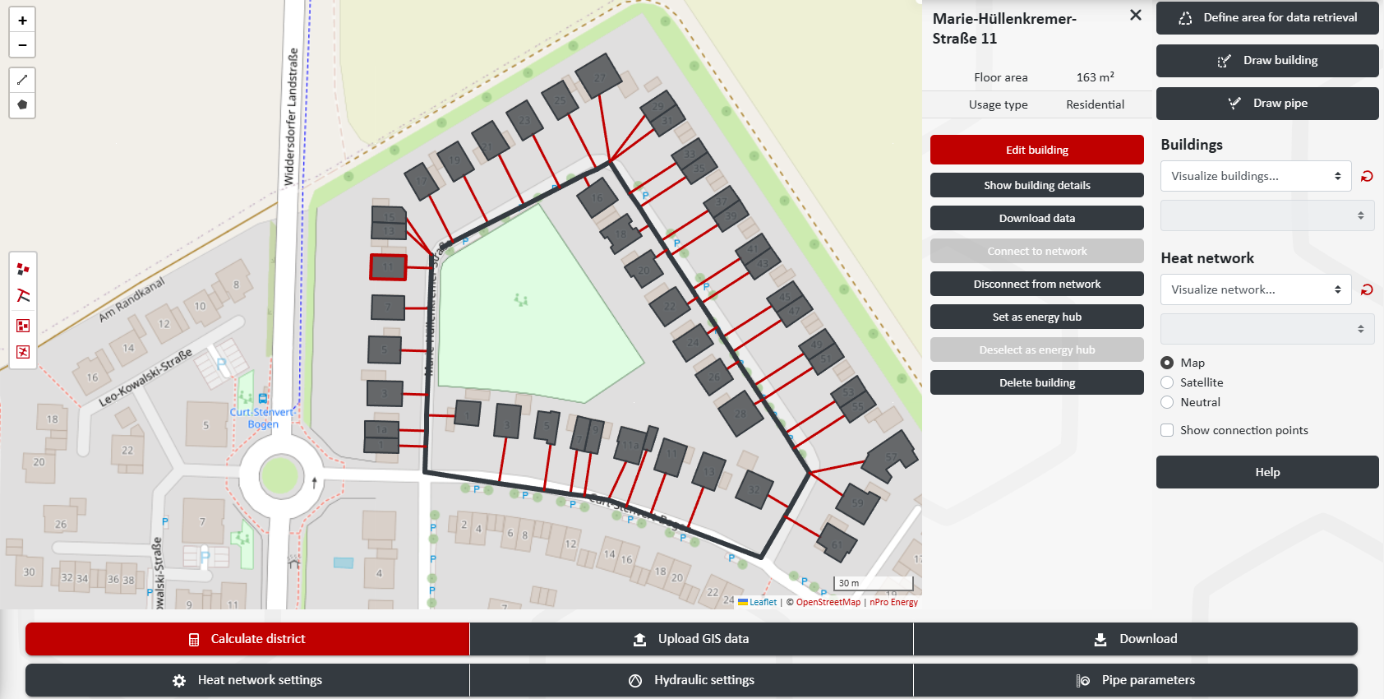
Finally, an energy hub must be defined. To do this, first use to place a representative building for a planned energy hub on the map, or select an existing building. With , the selected building can now be set as the energy hub.
3) Buildings
After setting up the district, individual buildings (or optionally multiple/all buildings at once) can be selected, and their individual building data can be viewed or modified using
({filename='static/tool-heat-network-planning-building-data-settings.png'}).
Another way to define all buildings at once is by using the button. Here, building data can be imported as Excel, CSV, GeoJSON, GeoPackage, or Shape files. See also this section in the
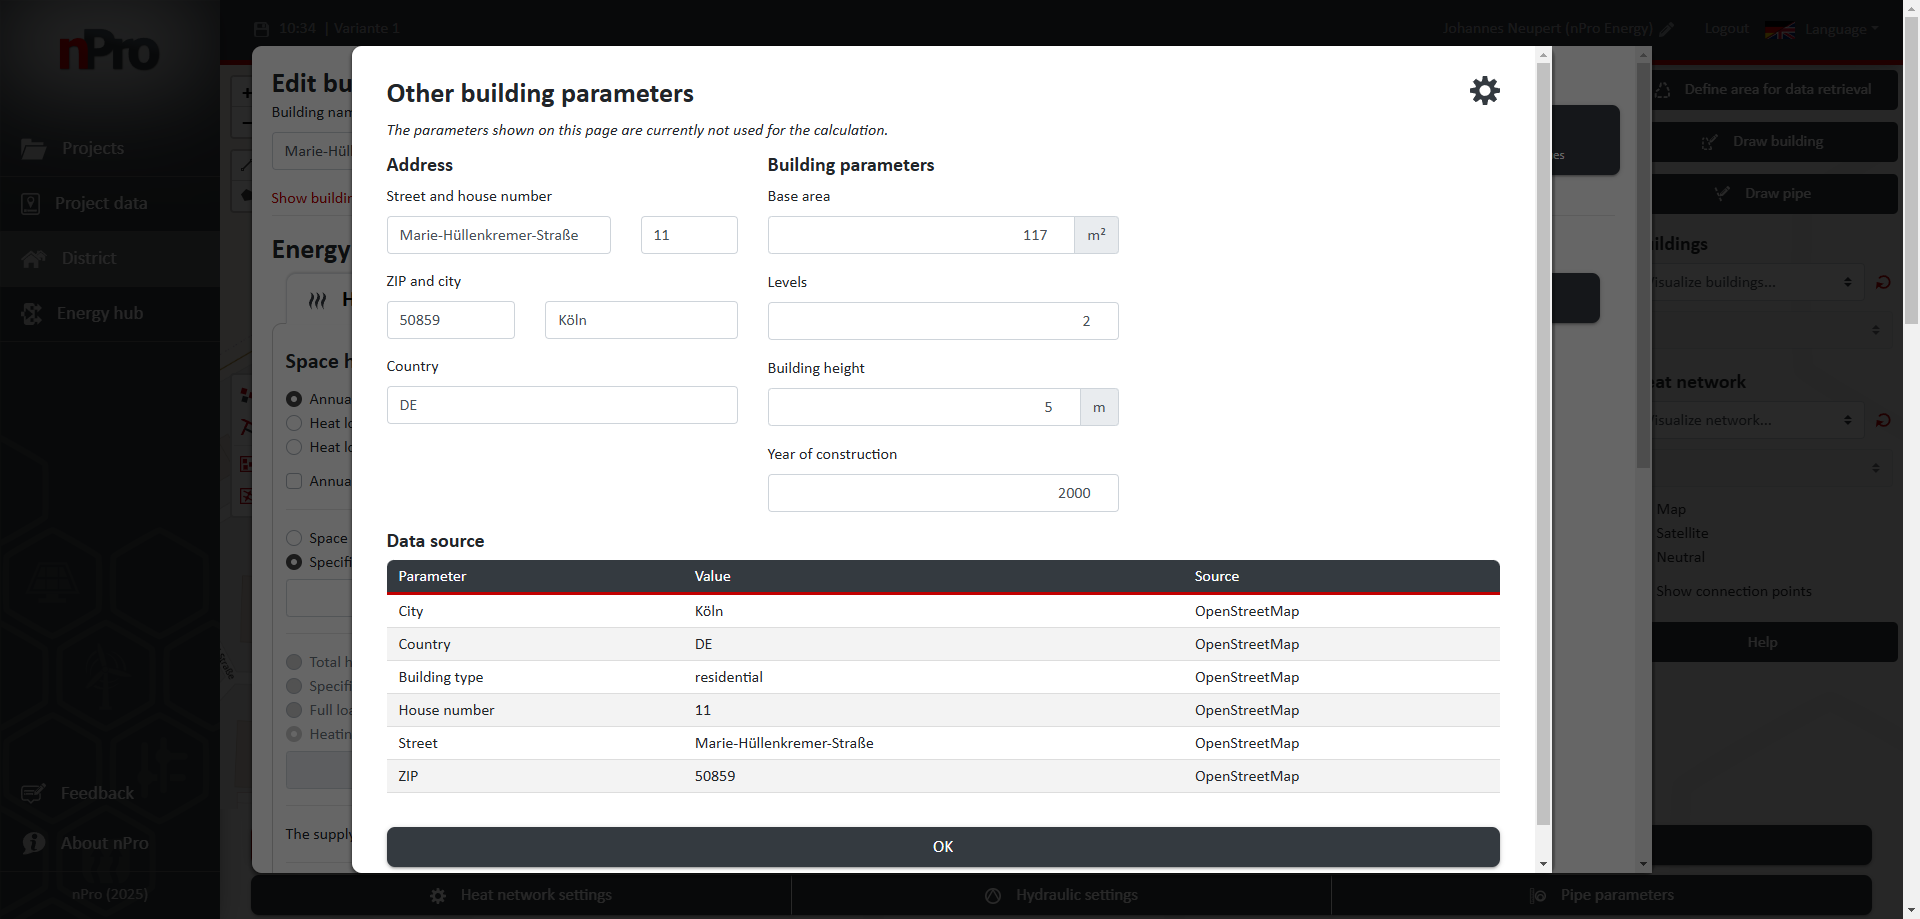
Using Edit Building, additional building parameters ({filename='static/tool-heat-network-planning-building-data-settings-details.png'}) can be manually added or modified:
- Address
- Floor area
- Number of floors
- Building height
- Year of construction
- Roof type
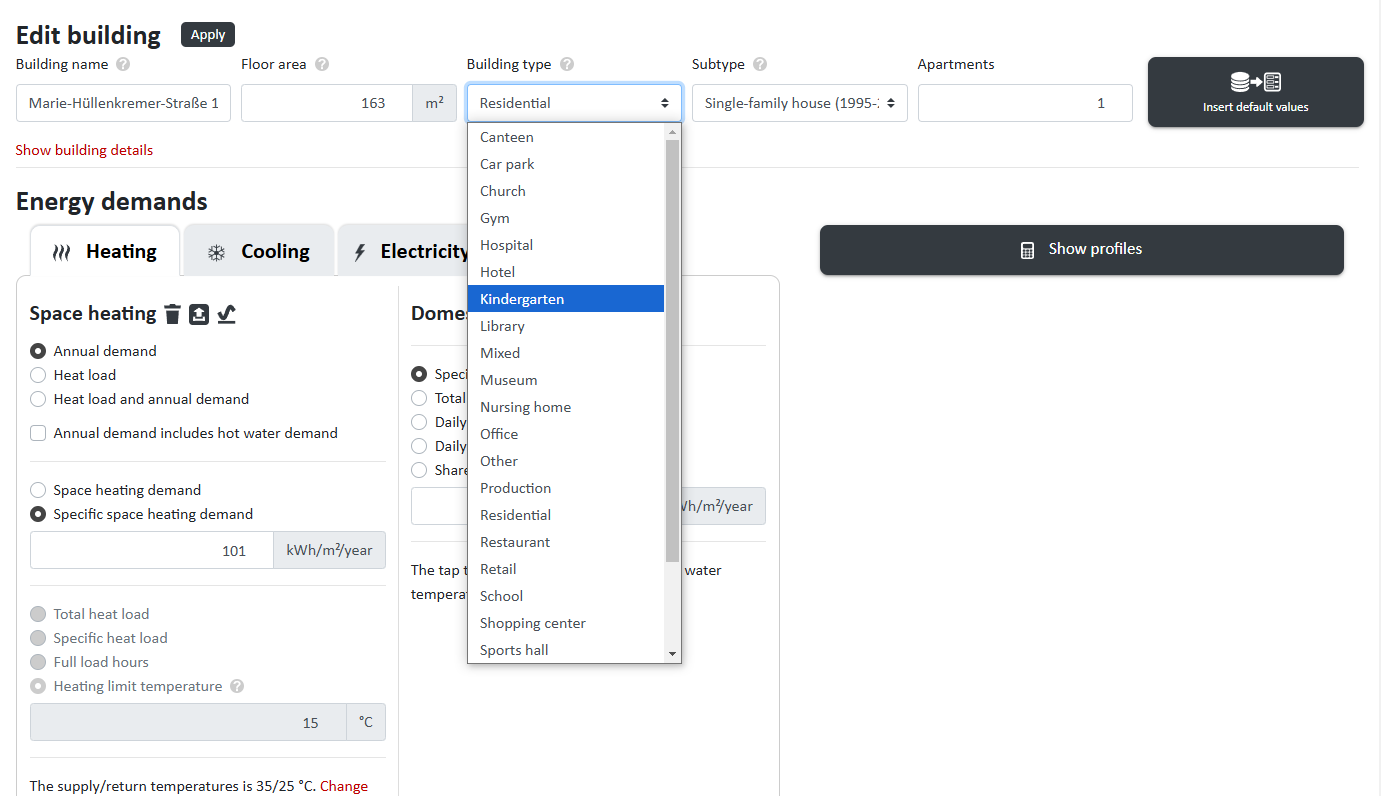
- Building type ({filename='static/tool-heat-network-planning-building-data-parameter-type.png'}): Residential building, office building, school, retail store, warehouse, production facility, hotel, restaurant, mixed-use (with customizable usage zones), etc.
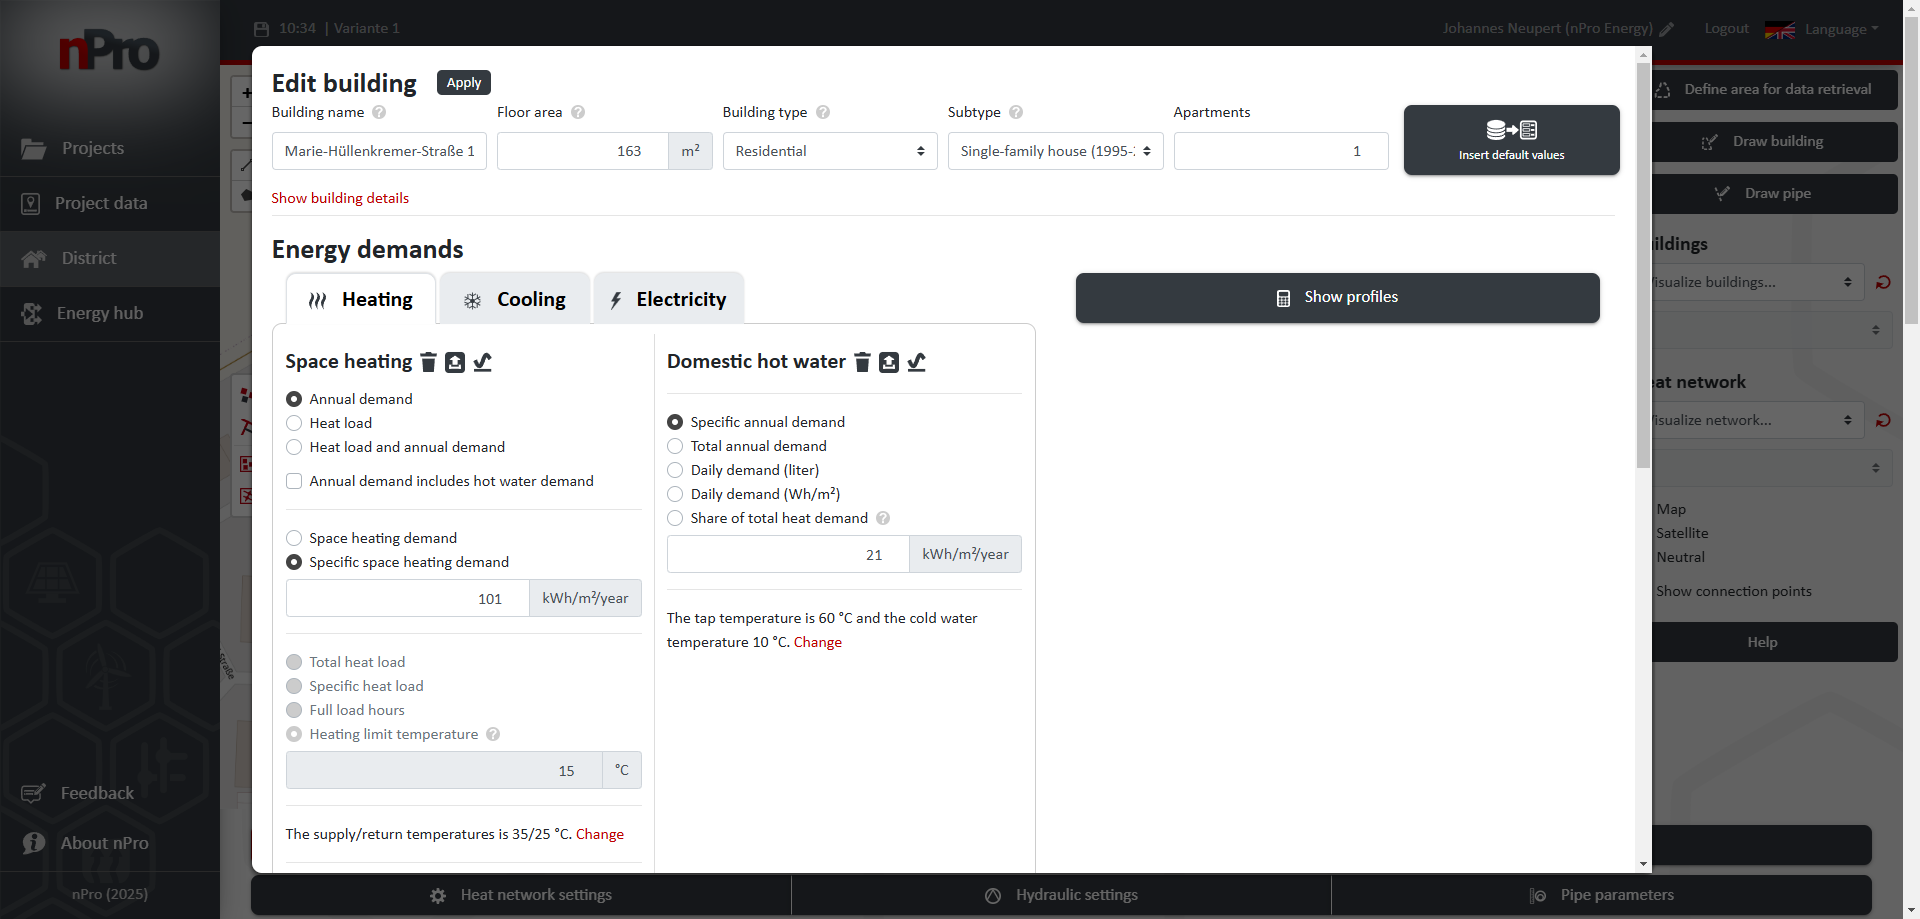
4a) Energy Demands: Heating
As the next step, the configuration of the various heating demands can be carried out.
Space Heating
The heating demand of each building can be set under Space Heating for different calculation methods:
- Annual demand (in MWh/year or specifically in kWh/m²/year)
- Heating load
- Heating load and annual demand
If the annual demand includes the domestic hot water demand, the total heat demand can be calculated using the converter for various fuels (heating oil, wood pellets, natural gas, liquefied petroleum gas, wood chips, firewood). The fuel consumption and the boiler efficiency can be entered to determine the total heat demand.
Additionally, further parameters can be configured:
- Supply temperature
- Temperature spread (supply/return)
- Heat recovery (ventilation)
- Heating period
For planned renovation measures, additional details on insulation measures and the heating system (e.g., radiator replacement) can be configured.
Domestic Hot Water
The demand for domestic hot water can be configured in detail according to the selected calculation method:
- Specific annual demand
- Annual demand
- Daily demand (liters)
- Daily demand (Wh/m²)
- Share of total heat demand
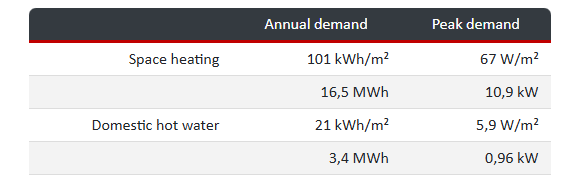
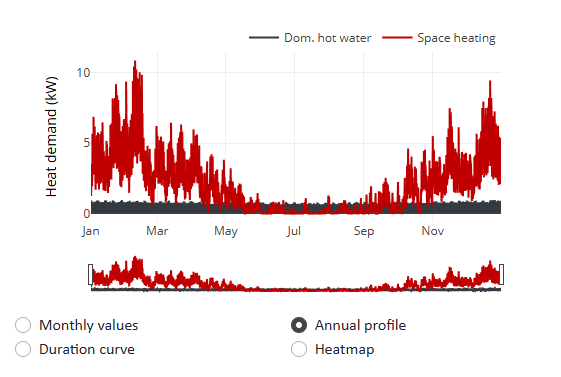
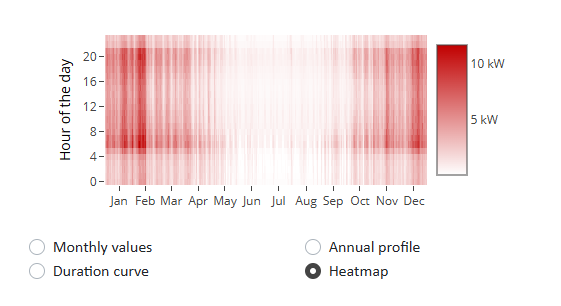
Custom values can also be set for tap temperature and cold water temperature. In the graphical representation of annual demand and maximum demand of the building for heating ({filename='static/tool-heat-network-planning-building-data-parameter.png'}), the button allows for flexible selection between:
- Annual profile ({filename='static/tool-heat-network-planning-building-data-annual.png'})
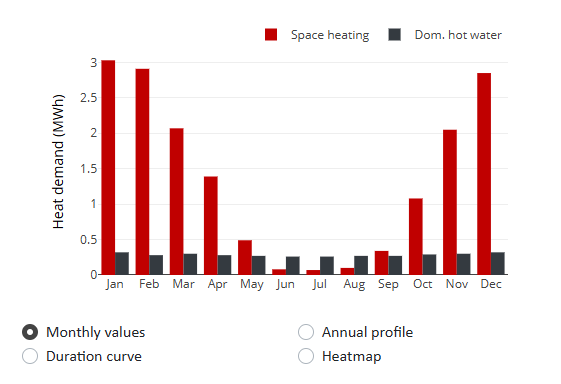
- Monthly values ({filename='static/tool-heat-network-planning-building-data-monthly.png'})
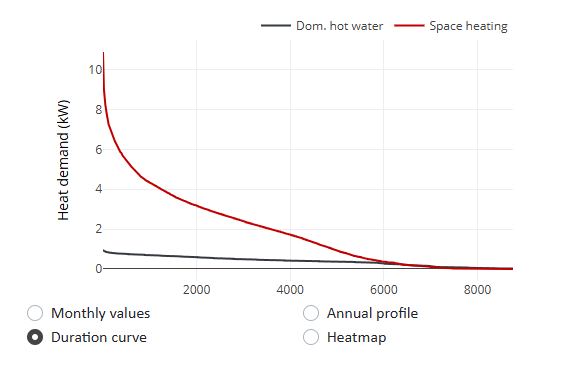
- Annual duration curve ({filename='static/tool-heat-network-planning-building-data-duration-curve.png'})
- Heatmap ({filename='static/tool-heat-network-planning-building-data-parameter-heatmap.png'})
A compact overview of all building details can be accessed via .
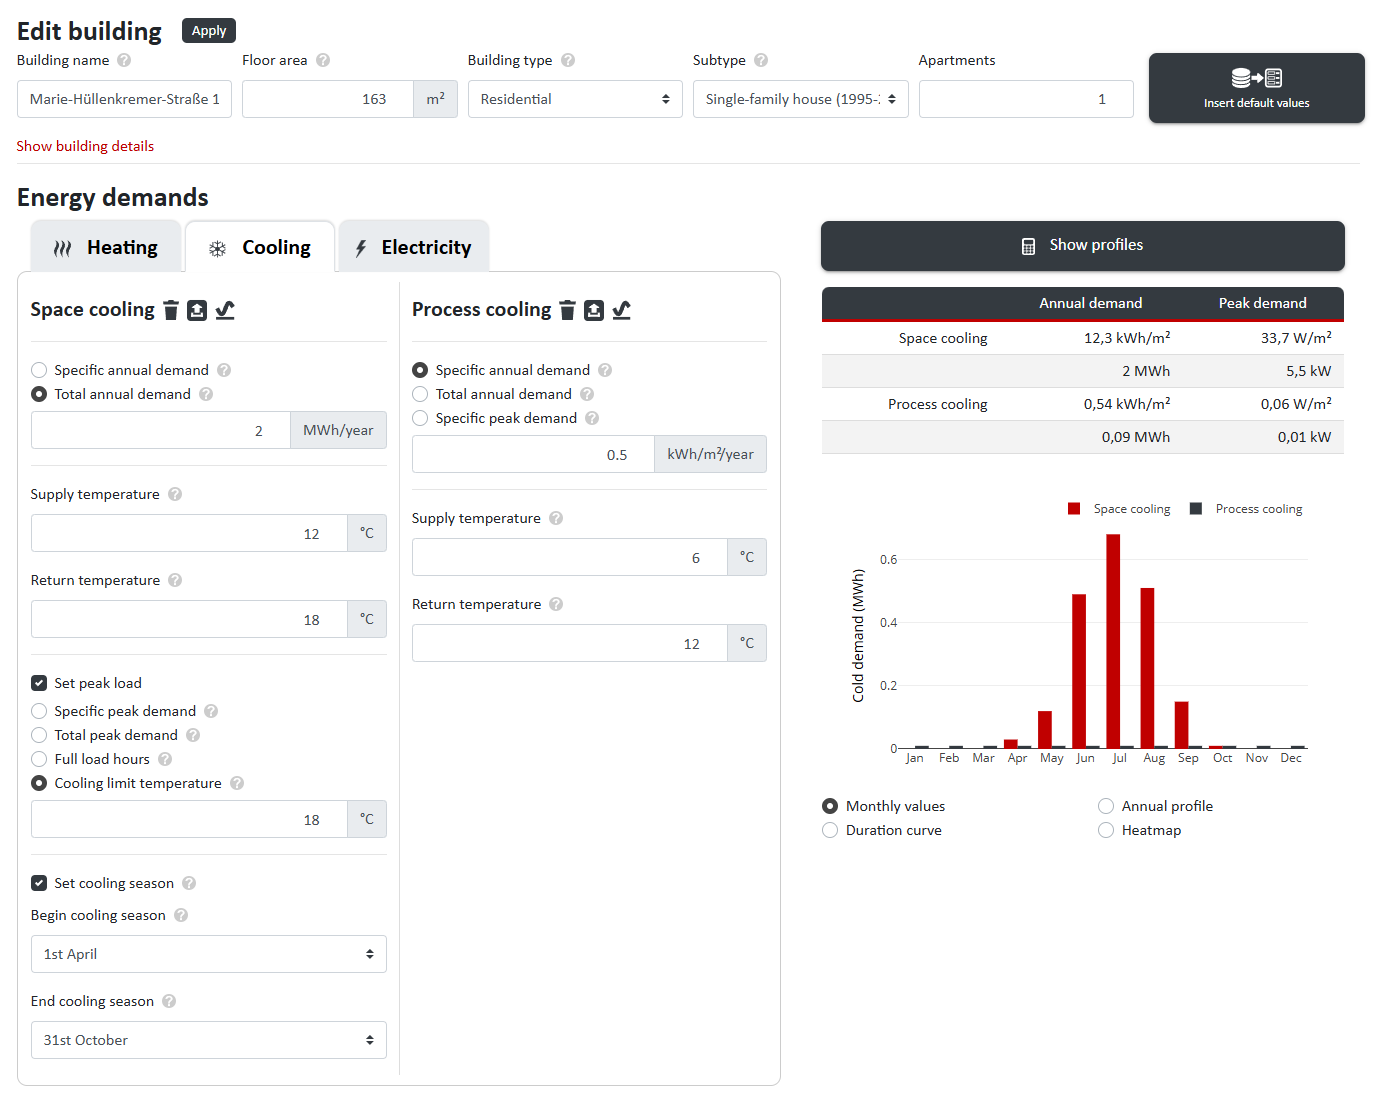
4b) Energy Demands: Cooling
Under Air Conditioning and Process Cooling, the following (specific) values can be set:
- Annual demands
- Supply temperatures
- Return temperatures
- Maximum cooling loads
- Cooling periods
for the building ({filename='static/tool-district-heating-planning-building-data-cooling.png'}). The following cooling sources are available under Cooling Generation:
- Passive/active cooling with a heating network
- Air-cooled chiller
- Decentralized geothermal probes (passive cooling)
- Cooling network (4-pipe system)
For a network chiller and (for peak load cases) an air-cooled chiller, either product data or the COP (Coefficient of Performance) as the efficiency metric of the chiller can be specified.
All entered values are incorporated into the subsequent operational calculations.
4c) Energy Demands: Electricity
In addition to user electricity consumption, the electricity demand for e-mobility can also be set separately ({filename='static/tool-district-heating-planning-building-data-electricity.png'}). For the given building, a charging station for an electric car is assumed with a demand of 4 MWh/year.
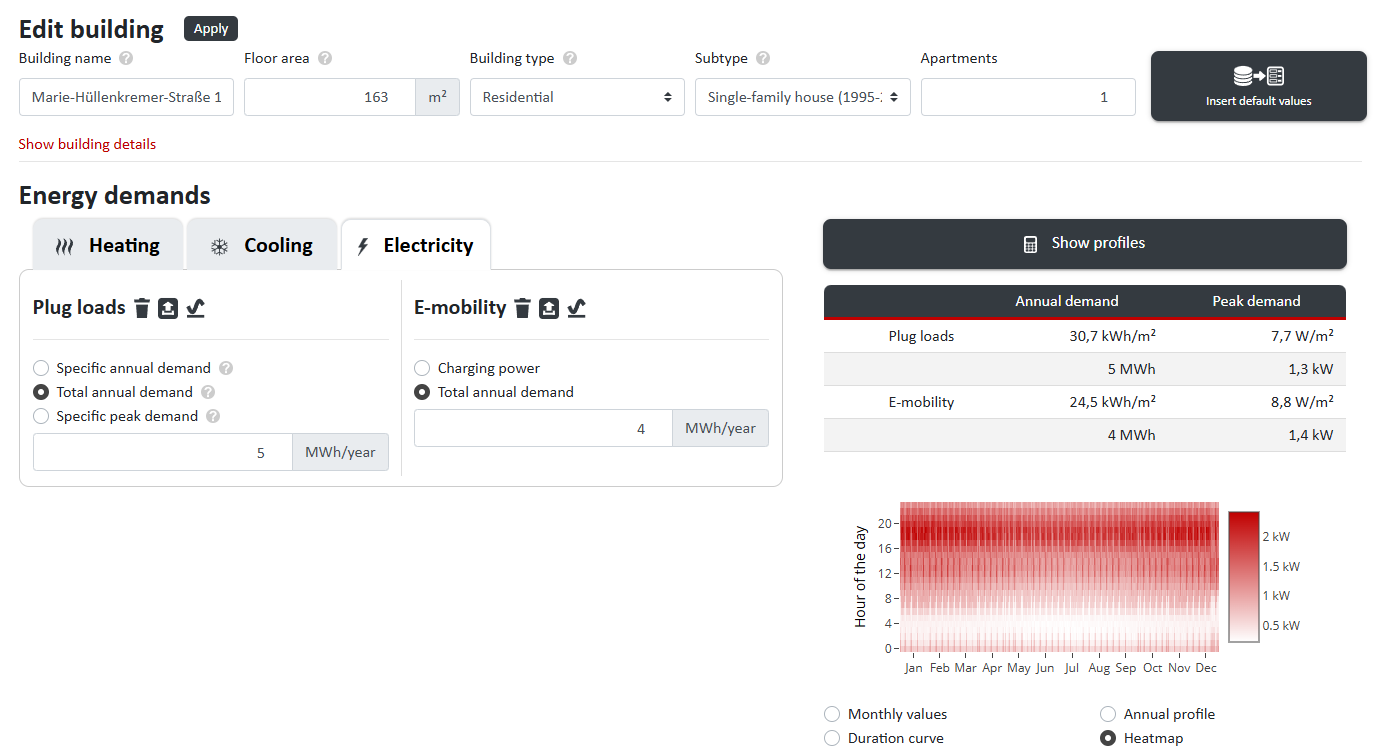
For each category of energy demand—heating, cooling, and electricity—individual profiles can be:
- Time series (text format)
- Load profiles (.profile file)
imported and exported ({filename='static/tool-heat-network-planning-building-data-import-export.png'}).
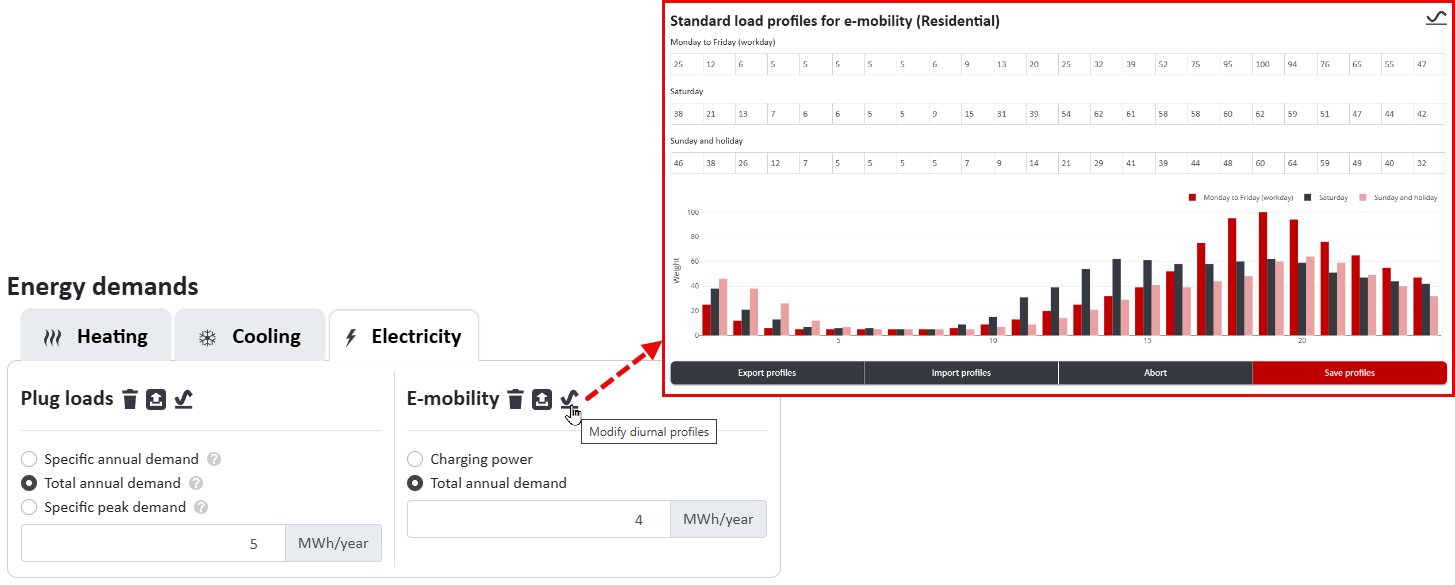
nPro utilizes a comprehensive database with daily profiles and energy performance indicators, enabling the creation of energy demand profiles with hourly resolution in just a few clicks. This allows for the generation of matching demand profiles for space heating, domestic hot water, air conditioning, process cooling, user electricity, and e-mobility.
5) Heating Network
In the main interface, specific settings for the following parameters can be configured via :
- Heat losses
- Network temperature:
- Constant
- Variable
- Via profile import
- Design method:
- Annual profiles
- Heating load
- Design criteria
- Simultaneity factor:
- Winter et al.
- Via profile import
- ISSO 7: Residential buildings / Commercial buildings
- Import custom profile
- Neglect simultaneity
- Heat transfer fluid:
- Water
- Brine: adjustable ethylene glycol content
- Soil parameters:
- Thermal conductivity
- Average installation depth
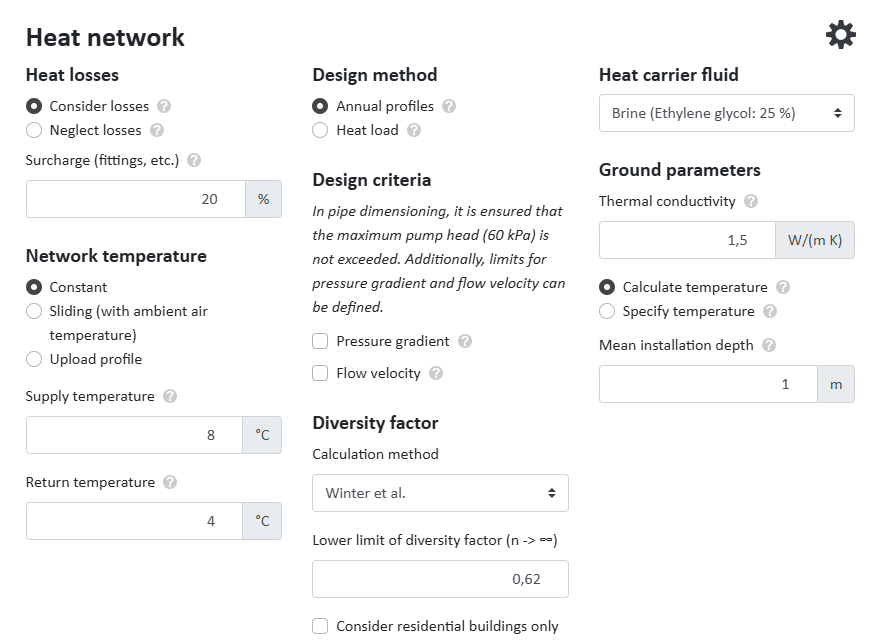
For mixed-use districts, there is also the option to consider only residential buildings in the simultaneity factor calculation.
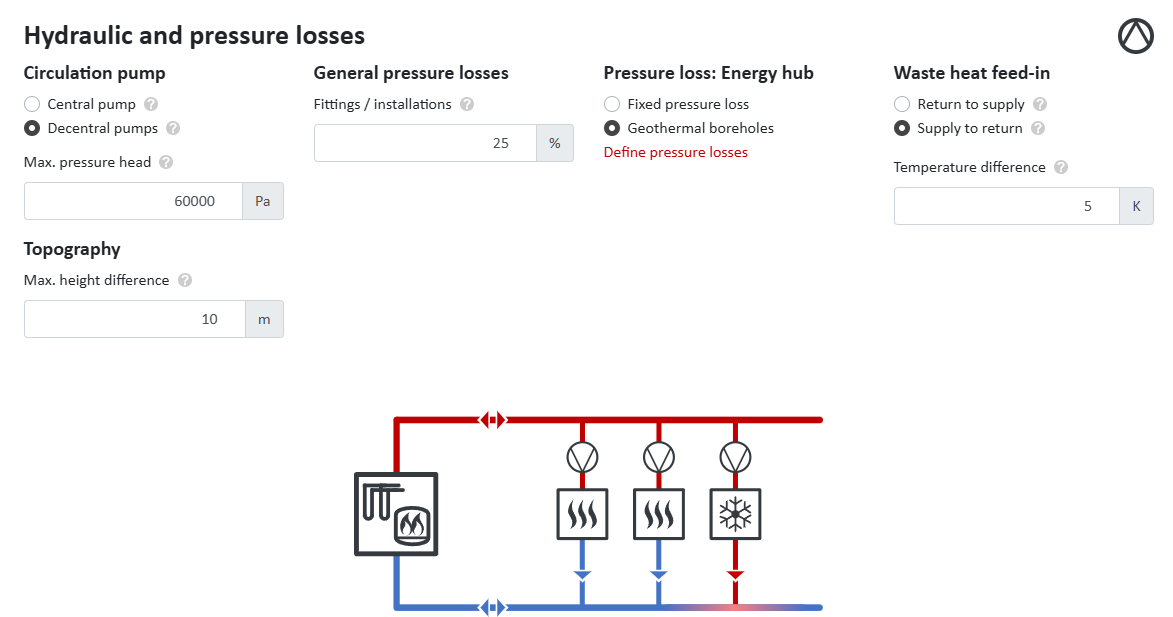
6) Hydraulics
Using the , various components of the hydraulic system and sources of pressure losses can be configured
({filename='static/tool-hydraulics-pressure-losses-topography-circulation-pump.png'}):
- Circulation Pump:
- Central pumps
- Decentralized pumps
- Maximum delivery head
- Topography:
- Max. height difference
- General Pressure Losses:
- Pipe installations
- Pressure Losses: Energy Hub:
- Flat-rate pressure loss
- Geothermal probes
- Waste Heat Injection:
- From return flow to supply flow
- From supply flow to return flow
- Temperature difference
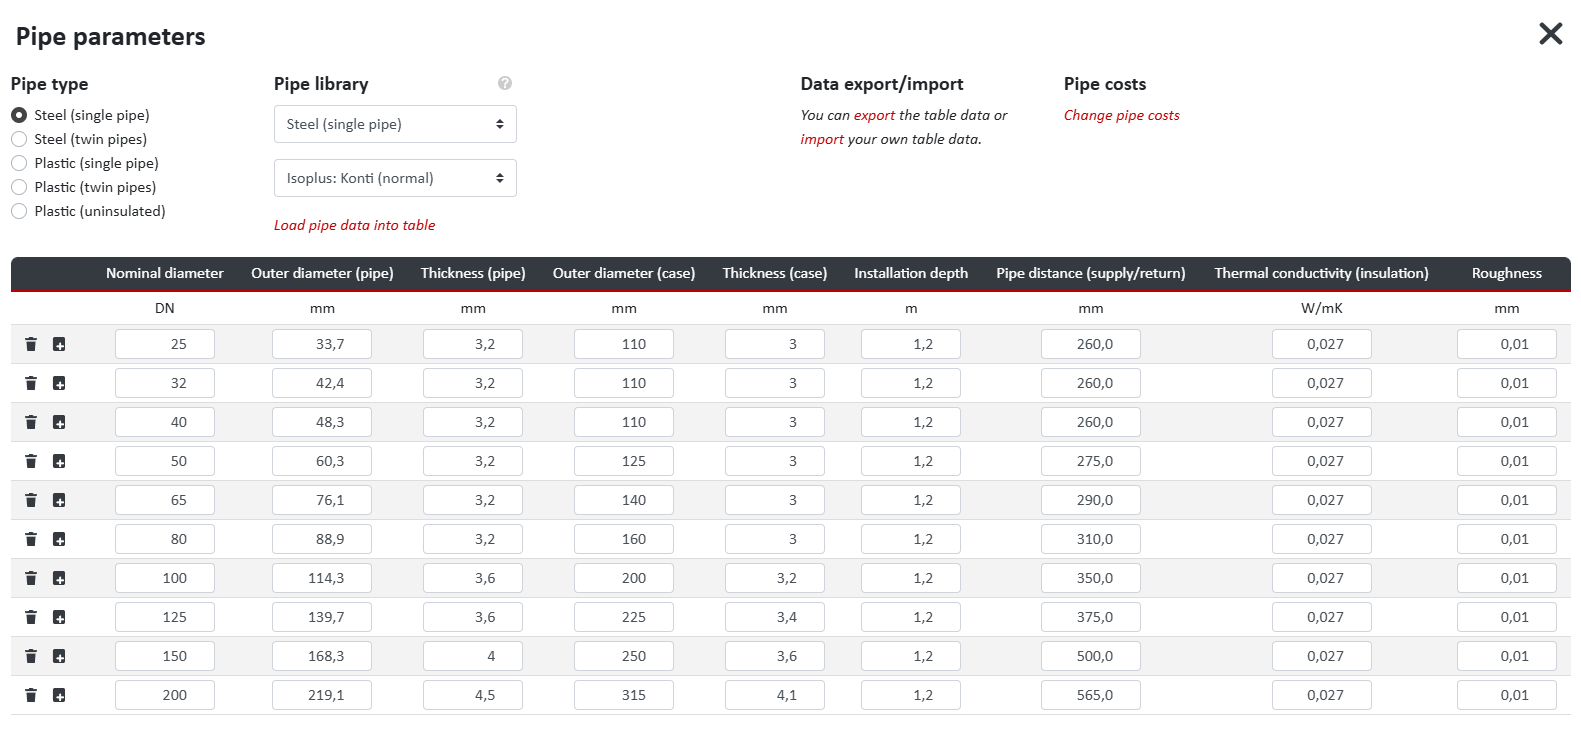
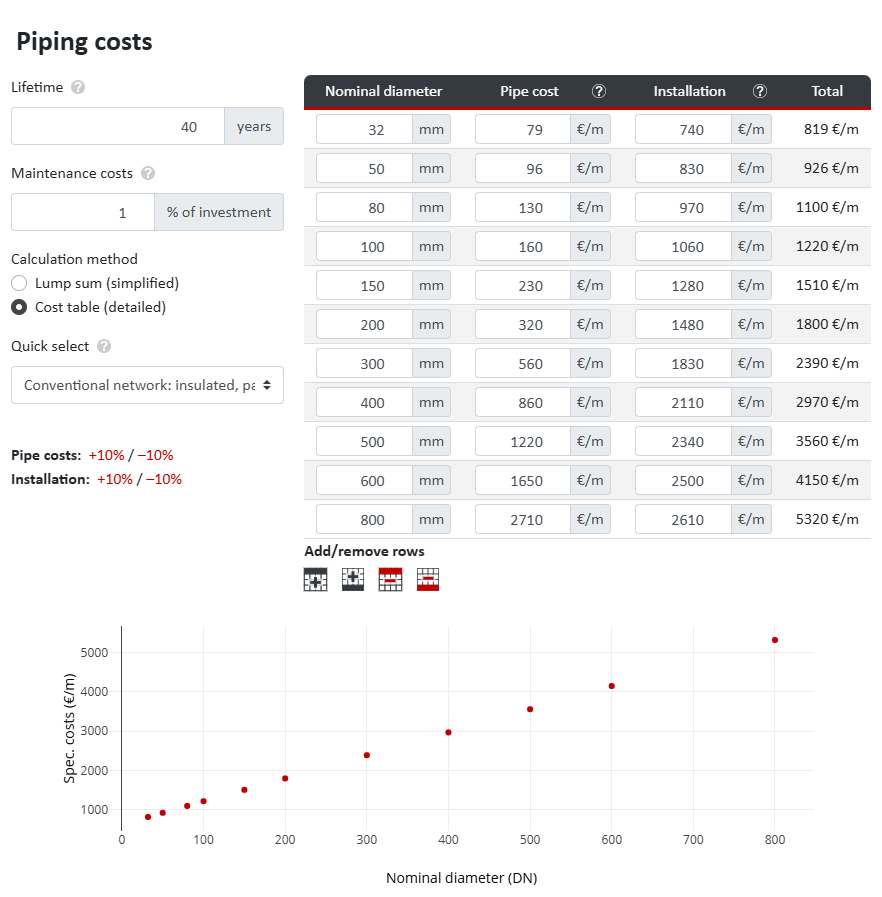
7) Pipe Parameters
Via , the pipe type and pipe costs can be configured.
Currently, data for steel and plastic pipes from various models of the following manufacturers are available:
- LOGSTOR
- ISOPLUS
- BRUGG Pipes
Additionally, custom pipe data can be imported or existing data can be exported ({filename='static/tool-pipe-sizing-type-costs-logstor-isoplus-bruggpipes.png'}).
8) Calculating the District
By selecting Calculate District, the district is designed based on the entered values, updating the heating network on the map.
Visualization and Modification of Parameters
In the main interface, under Buildings and Heating Network, various parameters can be selected and visualized on the map ({filename='static/district-heating-pipe-sizing-heat-demand-map.png'}).
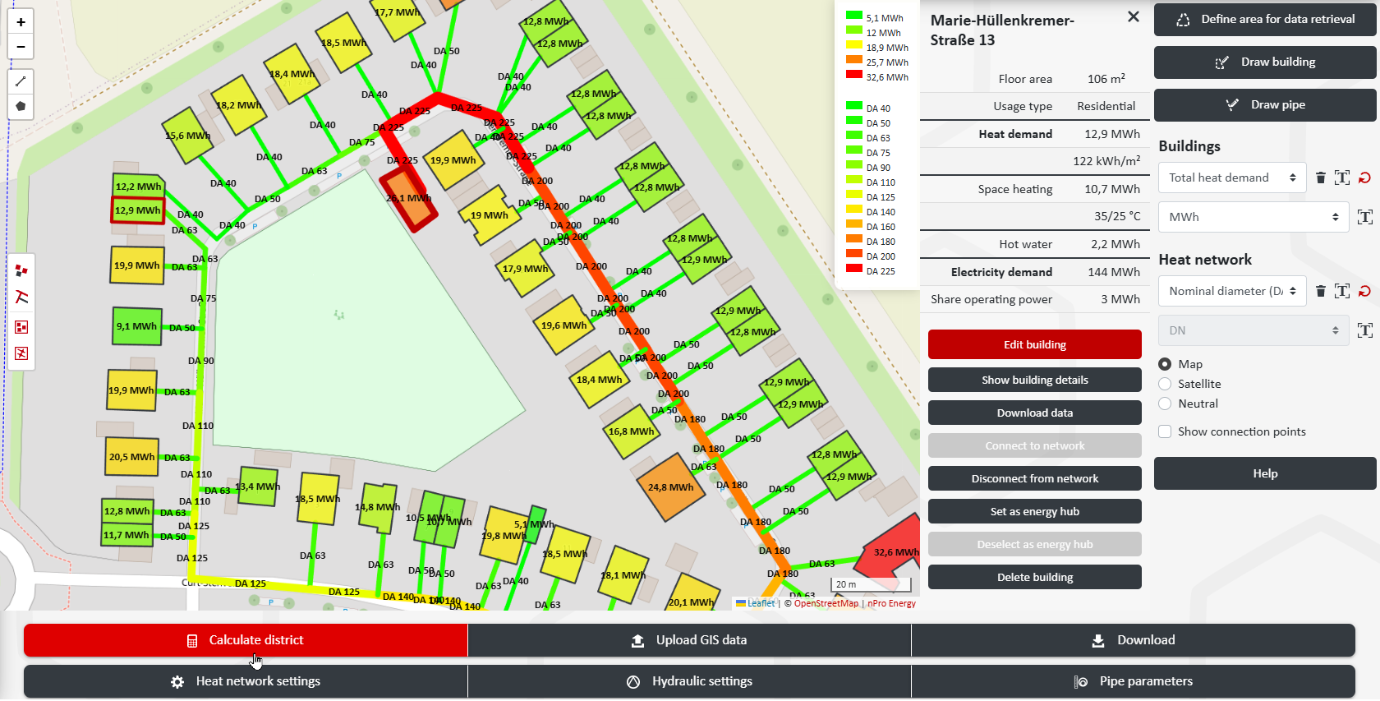
Which parameters for buildings or the heating network can be displayed on the map is shown in {table#}.
| Category | Parameter |
|---|---|
| Buildings | |
| Building Data | Usable area, floor area, building type, heating network connection, building name, address, street, house number, year of construction, building height, number of floors |
| Heating Demand | Total heat demand, space heating, domestic hot water, supply temperature (space heating/domestic hot water) |
| Cooling Demand | Total cooling demand, air conditioning, process cooling, supply temperature (air conditioning/process cooling) |
| Electricity Demand | Total demand (excluding operational electricity), user electricity, e-mobility, operational electricity |
| Additional Key Figures | Heat consumption from the network, heat injection into the network, waste heat used in the building, demand overlap coefficient (DOC) |
| Heating Network | |
| Design Results | Length, nominal diameter (DN), pressure loss, design capacity (incl. GLZF), volume flow, flow velocity, installation depth, pipe spacing, max. transferable power, utilization, capacity reserve (to check whether additional buildings can be connected), simultaneity factor |
| Simulation Results | Transferred heat quantity, linear heat density, heat losses, supply temperature, return temperature, volume flow |
After the district calculation, individual or all pipe sections can also be manually selected and configured.
Results: Summary
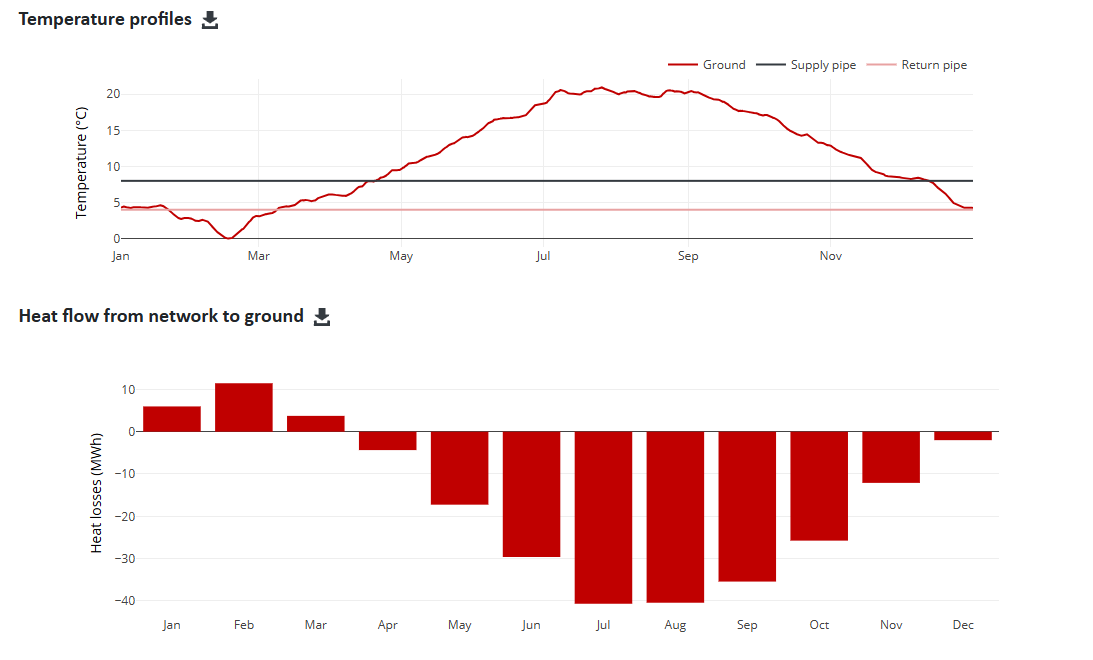
The results of the district calculation are displayed below the map in the tab, both in tabular form and as graphical representations with flexible profile visualizations ({filename='static/results-district-heating-planning-losses-injection.png'}).

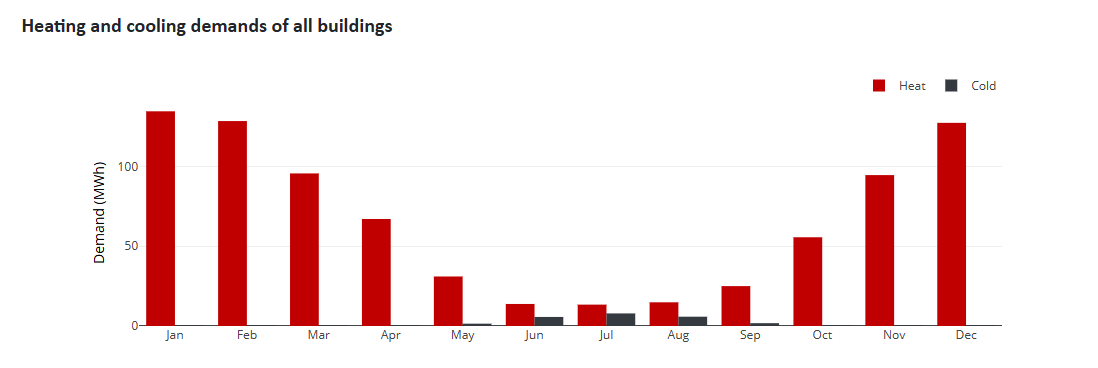
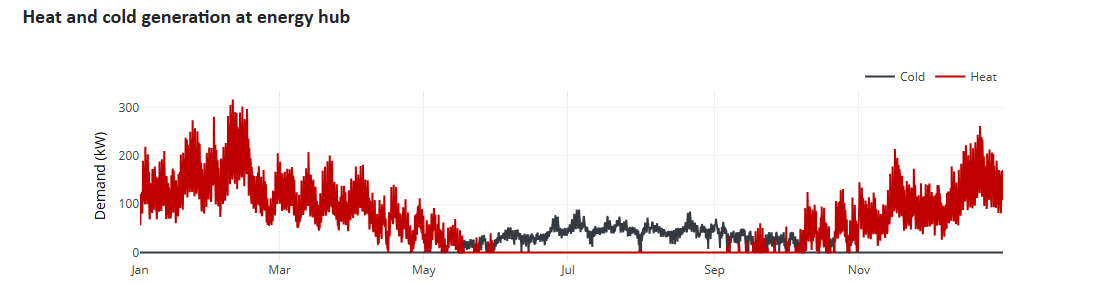
Additionally, graphical visualization of profiles in the form of diagrams is possible ({filename='static/results-heat-cooling-demands-district-monthly-profile.png'} and {filename='static/results-heat-cooling-demands-injection-energy-center.png'}). Users can flexibly choose between different display options:
- Monthly values
- Annual profile
- Annual duration curve
- Heatmap
Below this, there is an equivalent overview of the results for electricity (user electricity, e-mobility) and operational electricity (e.g., booster heat pumps).
Results: Heating Network
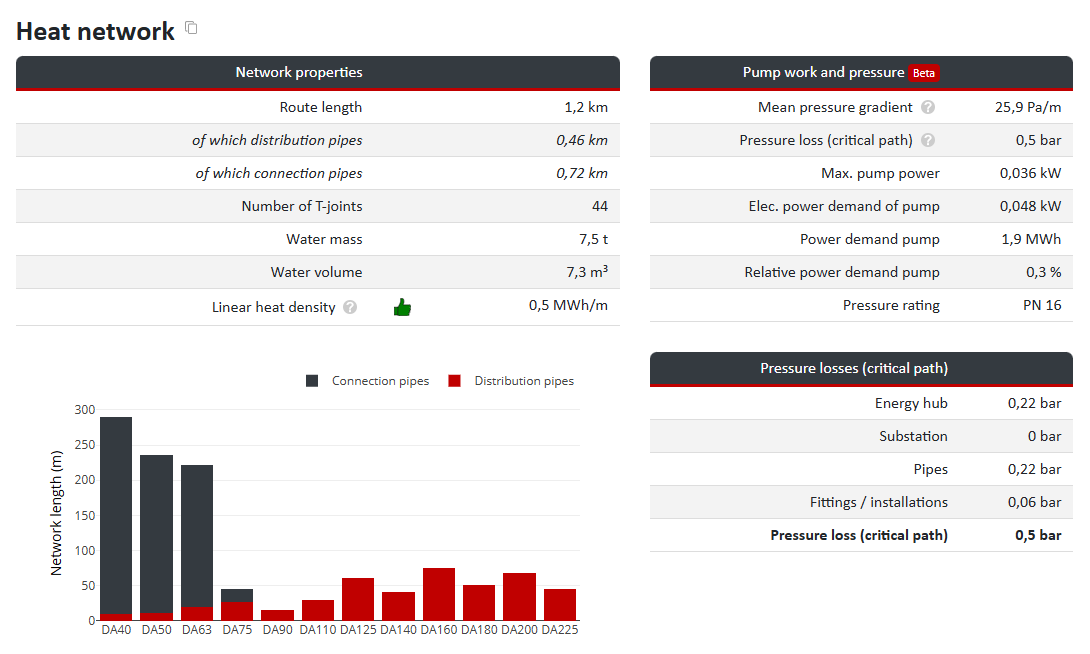
The tab provides a dedicated overview of the heating network parameters ({filename='static/results-heating-cooling-pump-work-pressure-losses.png'}).
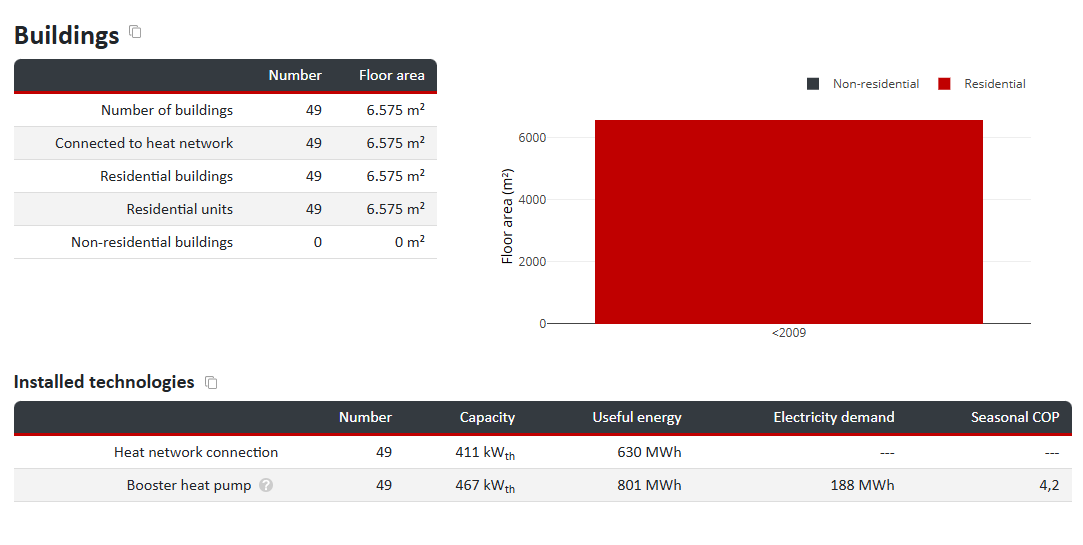
Results: Buildings
The tab provides a separate overview of how buildings are supplied ({filename='static/results-heat-cooling-demands-building-booster-heat-pump.png'}).
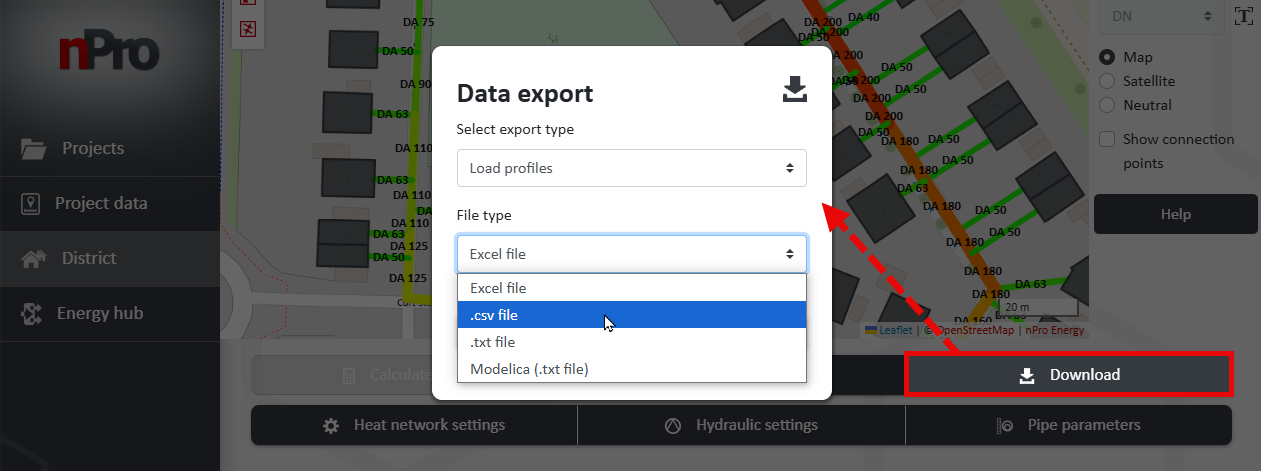
The download of results is done via the button ({filename='static/tool-data-export-building-heating-heat-pump-routes-geojson.png'}). Various datasets can be selected:
- Building list: Excel file
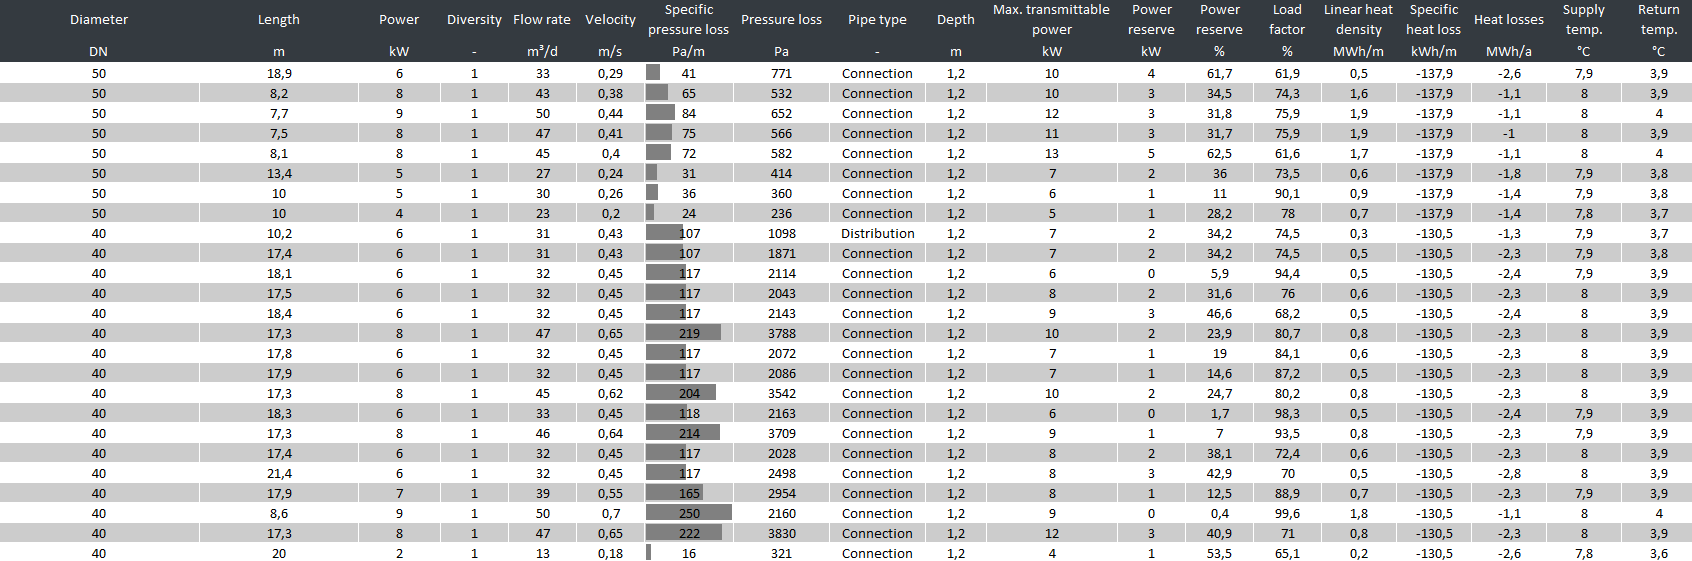
- Route list: Excel file ({filename='static/tool-data-export-building-heating-heat-pump-routes-excel.png'})
- Load profiles: Excel, .txt (Text or Modelica), .csv file
- Geo data: GeoJSON file
For example, the Building List allows checking the completeness of the recorded building data, while the Route List provides the pressure loss for each pipe section. The GeoJSON file can be used to import district geodata into QGIS, whereas the load profiles can be further processed in Excel or Modelica.
9) Energy Hub
On the left menu, the can be selected.
Graphical Overview
In the graphical overview for covering heat and electricity demand, components of various technologies can be selected with a mouse click and connected to the energy network ({filename='static/superstructure-en.svg'} and {filename='static/energy-center-heat-pump-geothermal-photovoltaics.png'}). The electricity demand can thus be met through various sources, such as:
- Photovoltaics
- Wind power
- Electric grid
For meeting the heat demand, numerous technologies are available, including:
- Solar thermal
- Heat storage
- Air-source heat pump
- Peak load boiler
- CHP (Combined Heat and Power)
- Electric heating elements
- Heat-cold sources: for flexible time series, e.g., wastewater heat, data center, lake water, river water

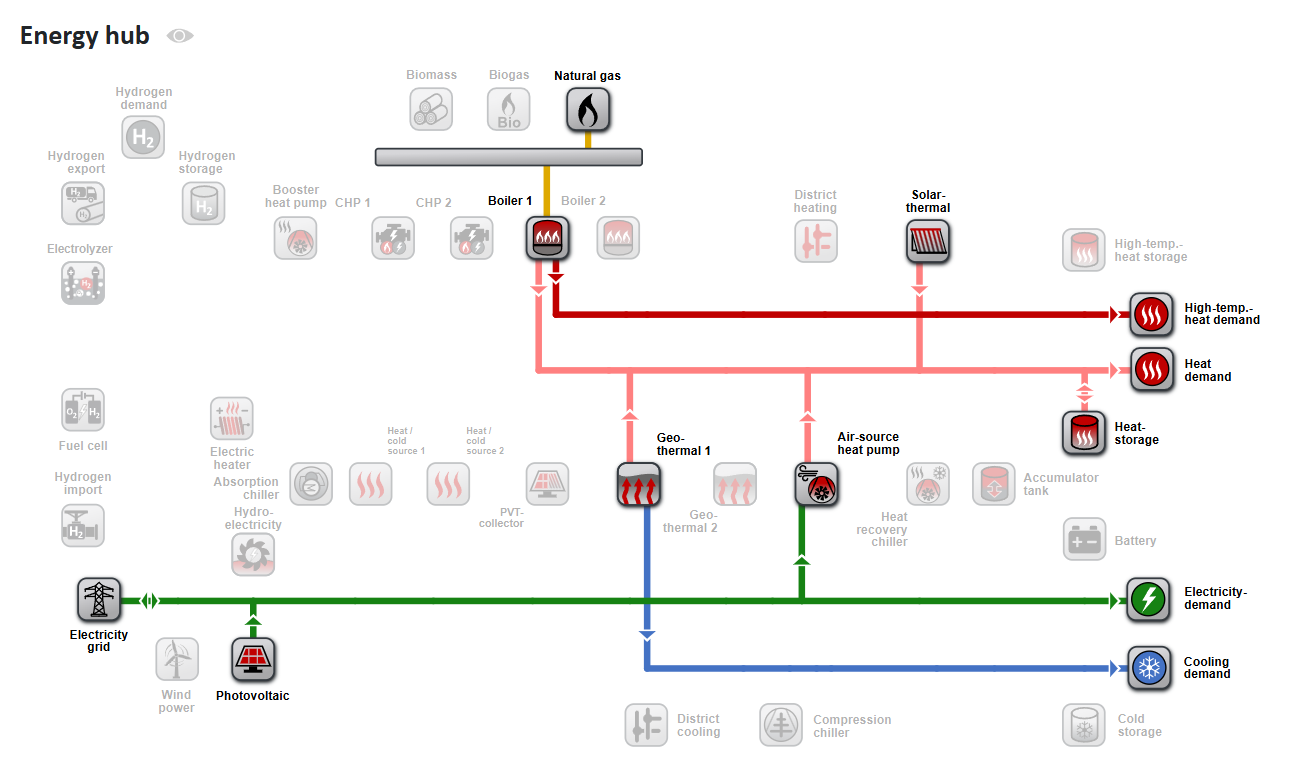
For further analysis, a heating network without cooling demand is assumed here (Figure 31).
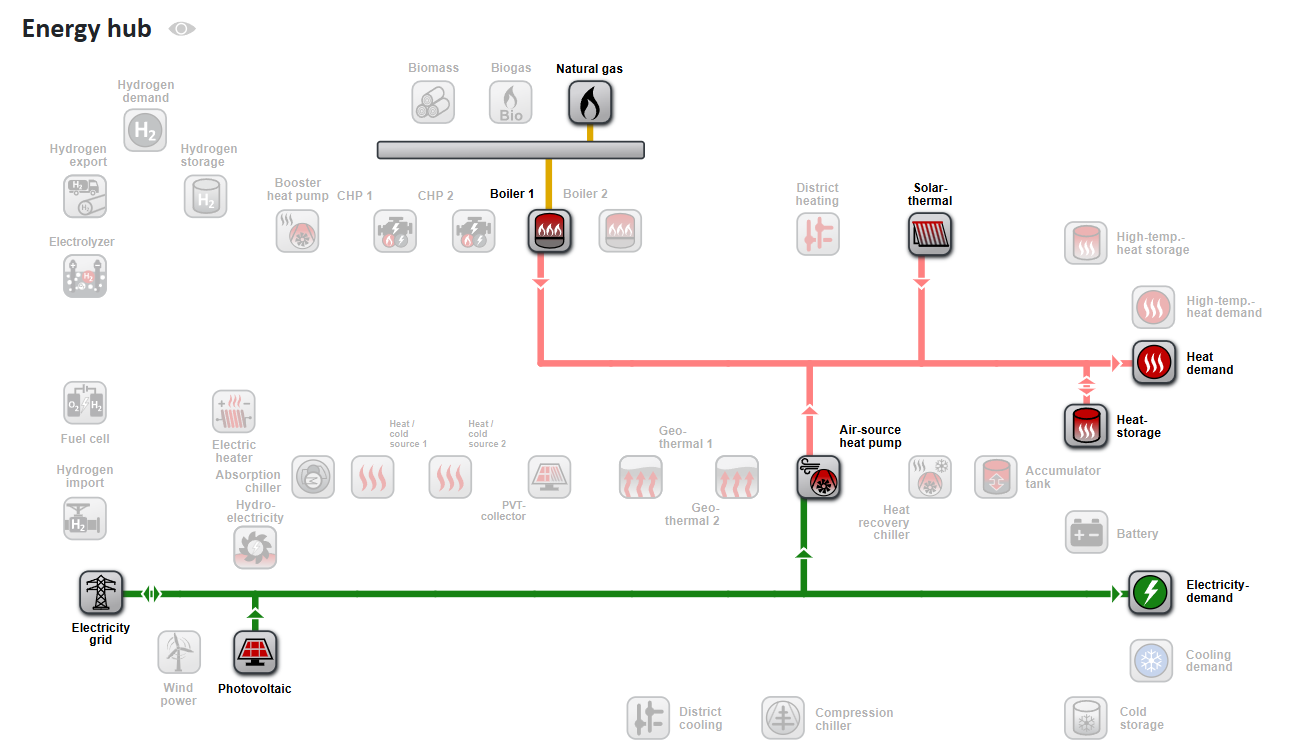
Additionally, in the energy hub, the hydrogen demand can be defined, and the hydrogen supply can be controlled. An electrolyzer can be integrated into the system, utilizing excess PV electricity for hydrogen production. The heat generated from this process can be directly fed into the heating network. Alternatively, hydrogen can be sourced from the gas grid and used for heat generation.
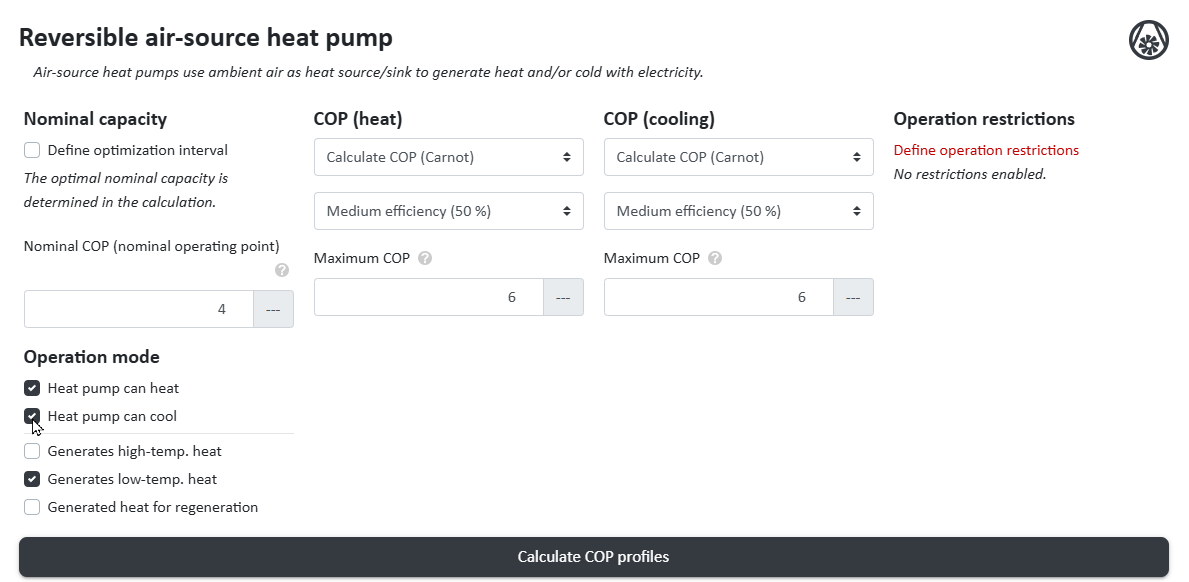
Technology Selection
Under , the technologies can be configured in detail ({filename='static/superstructure-en.svg'} and {filename='static/energy-center-heat-cooling-power-demand-geothermal.png'}).
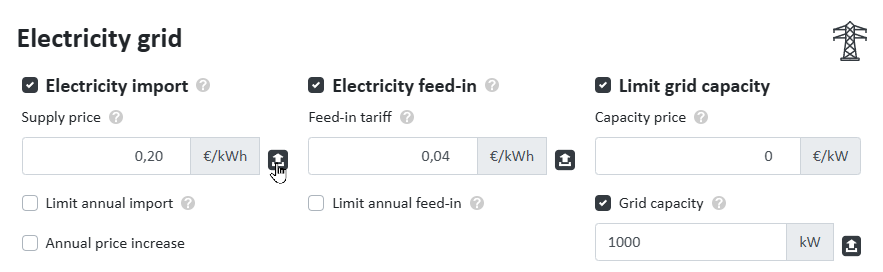
Energy Import
Under , the electricity prices and gas prices can be configured:
- Electric grid: Energy price, feed-in tariff ({filename='static/energy-center-electricity-supply-gas-grid-energy-price.png'})
- Natural gas supply: Energy price
Technology Costs
Using the button, the respective costs for the applied technologies can be configured ({filename='static/energy-center-investment-maintenance-costs-vdi-2067.png'}).
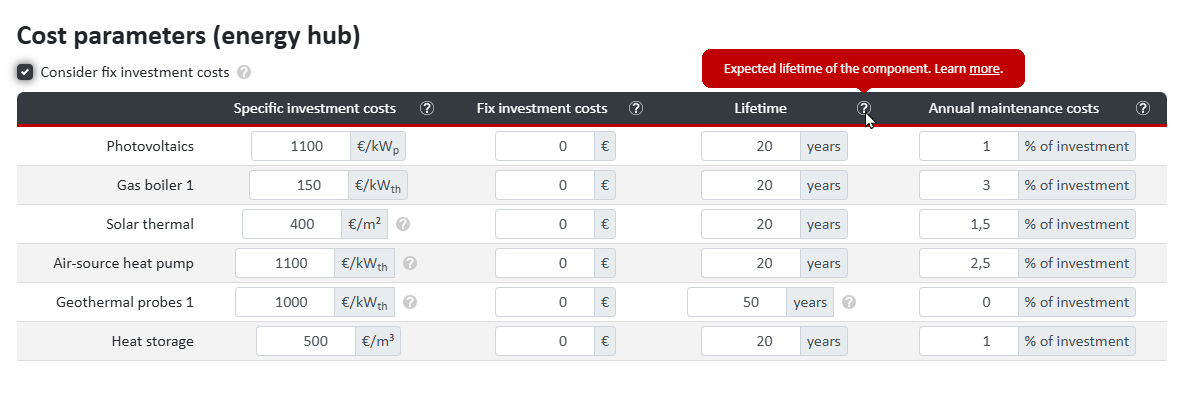
A detailed description of how economic parameters are incorporated into the economic efficiency calculation can be found in this article:
Optimization Goal & Ecological Parameters
The button allows for the configuration of emission and primary energy factors, reduction targets, and CO₂ pricing.
In the , different optimization goals can now be selected:
- Net present value / annualized total costs
- Multi-objective optimization: Net present value & CO₂ emissions
- CO₂ emissions
- Minimal electricity purchase from the power grid (maximum self-sufficiency)
System Sizing
By clicking , the calculation is started based on all parameters, costs, and the selected optimization goal. The result is shown in {filename='static/dimensioning-natural-gas-air-source-heat-pump-solar-thermal.png'}.
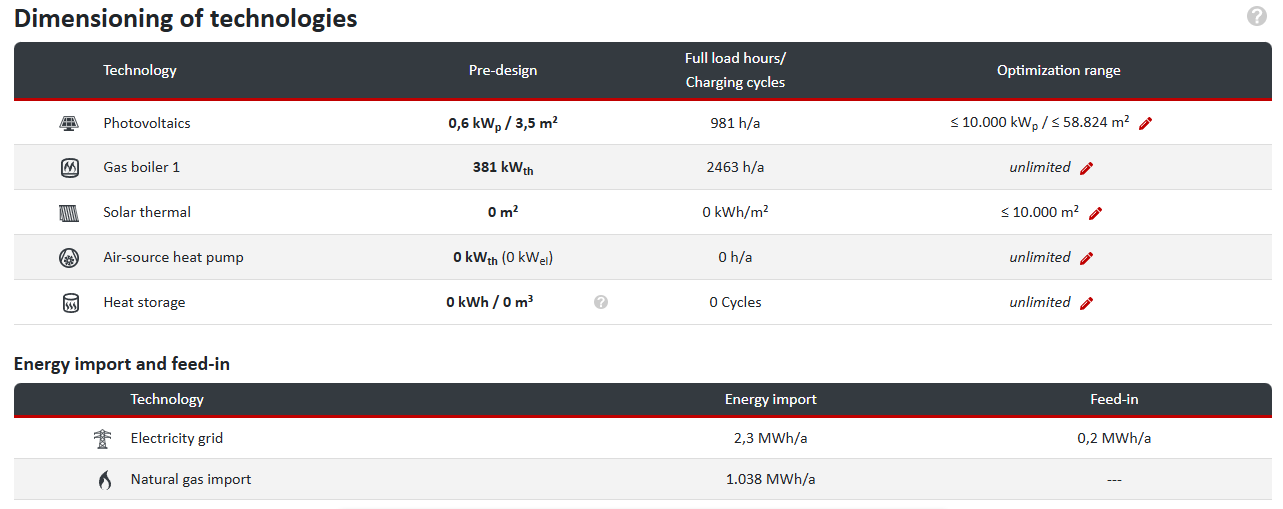
Depending on the technical parameters and the configured costs of the various energy sources, the model determines the optimal distribution of the available technologies to meet the energy demands of the district. This distribution can vary significantly depending on the selected optimization goal.
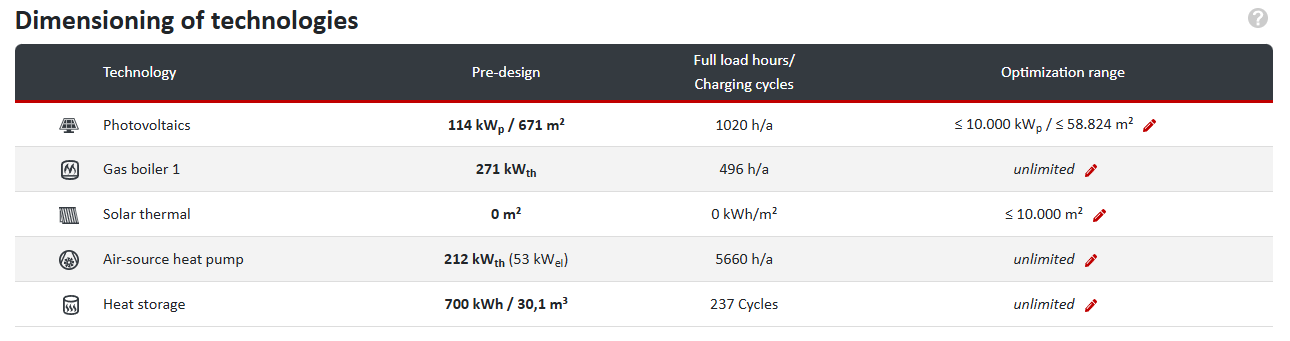
To adjust the distribution from {filename='static/dimensioning-natural-gas-air-source-heat-pump-solar-thermal.png'} in favor of renewable energy and heat sources, the gas price can be increased. A new system sizing calculation will now generate a different distribution, see {filename='static/dimensioning-district-heating-gas-air-source-heat-pump-solar.png'}.
To meet the real project requirements (e.g., regarding the share of renewable energies) or given constraints (e.g., available space for photovoltaics or capacity for heat storage), individual systems can be fine-tuned for optimal sizing.
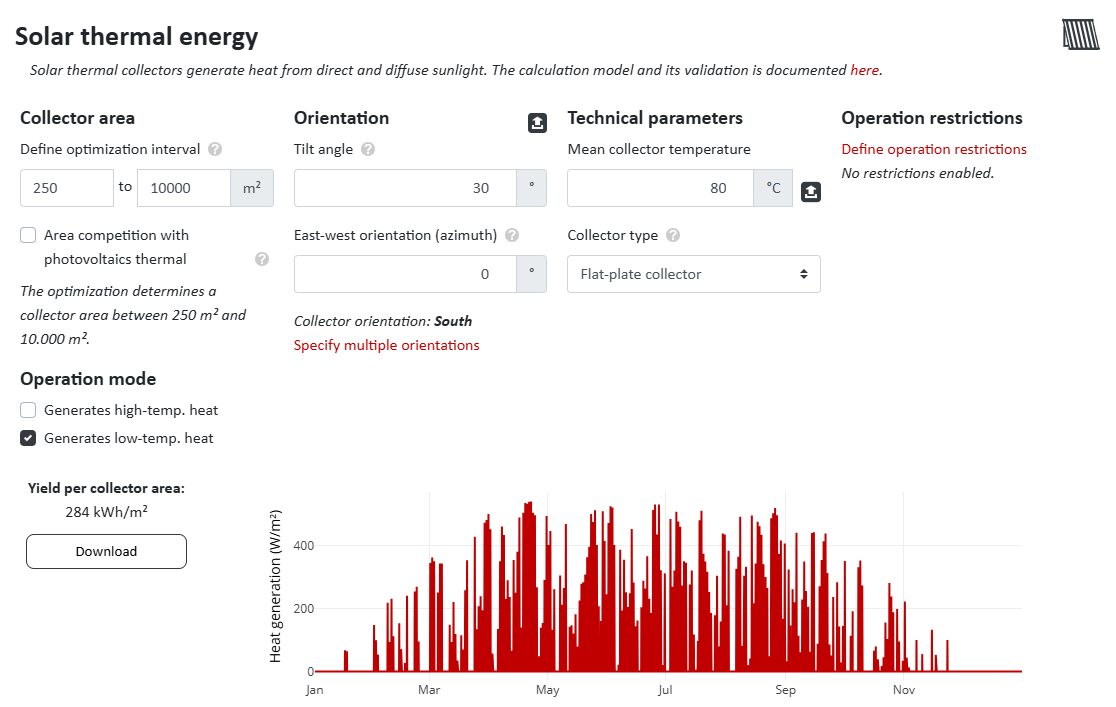
If regulatory or political requirements dictate the use of renewable energy sources, these can be individually set in the corresponding systems. For the district under consideration, a minimum solar thermal collector area of 250 m² is required ({filename='static/energy-center-photovoltaics-solar-thermal-collector-area.png'}).
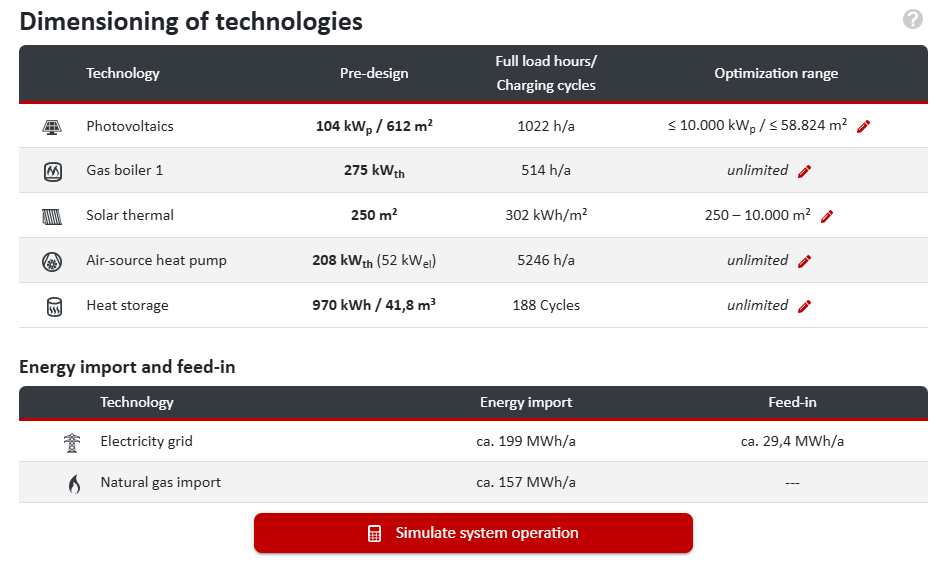
Clicking again updates the system layout ({filename='static/dimensioning-gas-heat-pump-solar-thermal-guidelines.png'}).
Simulation of System Operation
Once the system sizing is satisfactory, the simulation of the energy system's operation is initiated via , generating an energy flow diagram.
The different thicknesses of the energy flow lines are proportional to the amount of energy transferred, which is also displayed when hovering over them with the mouse ({filename='static/simulation-energy-flows-heat-power-demand-diagram.png'}).
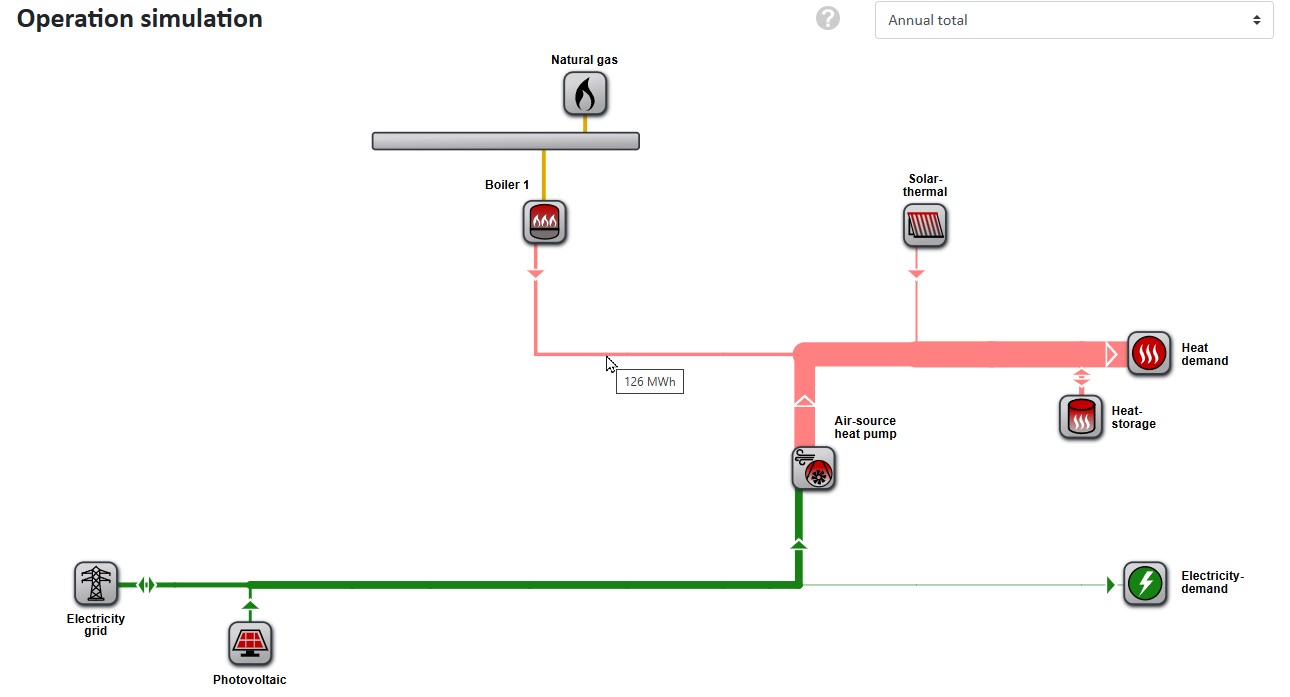
The time period represented in the energy flow diagram can be customized. Available options include the annual total, the winter or summer half-year, the four seasons, and individual calendar months. In the present example, during summer, heat is primarily sourced from solar thermal and less from the natural gas boiler. Selecting the summer half-year will adjust the energy flow lines in the energy flow diagram accordingly, making them thicker or thinner.
Below the diagram, nPro offers various visualization options for the results:
- Electricity balance
- Heat balance
- Hydrogen balance
- Electric grid: Consumption & feed-in
- Renewable energies
- Energy demands
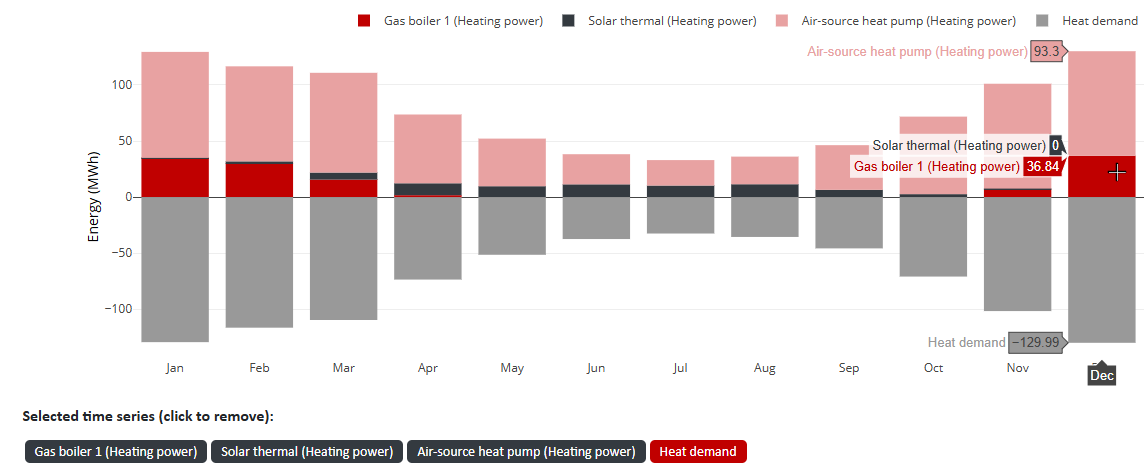
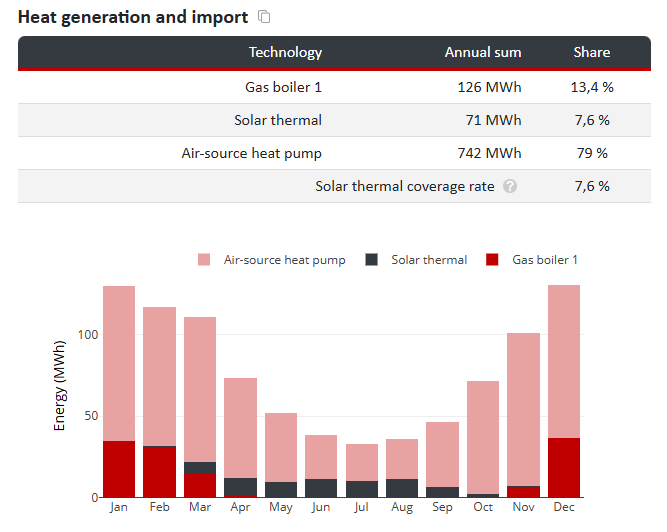
Again, profile visualization is possible as a monthly or annual profile, a duration curve, or a heatmap ({filename='static/simulation-time-series-visualization-solar-thermal-monthly-values.png'}). The monthly profile clearly shows that the natural gas boiler operates mainly in winter, while solar thermal is used primarily in summer, whereas the air-source heat pump operates year-round.
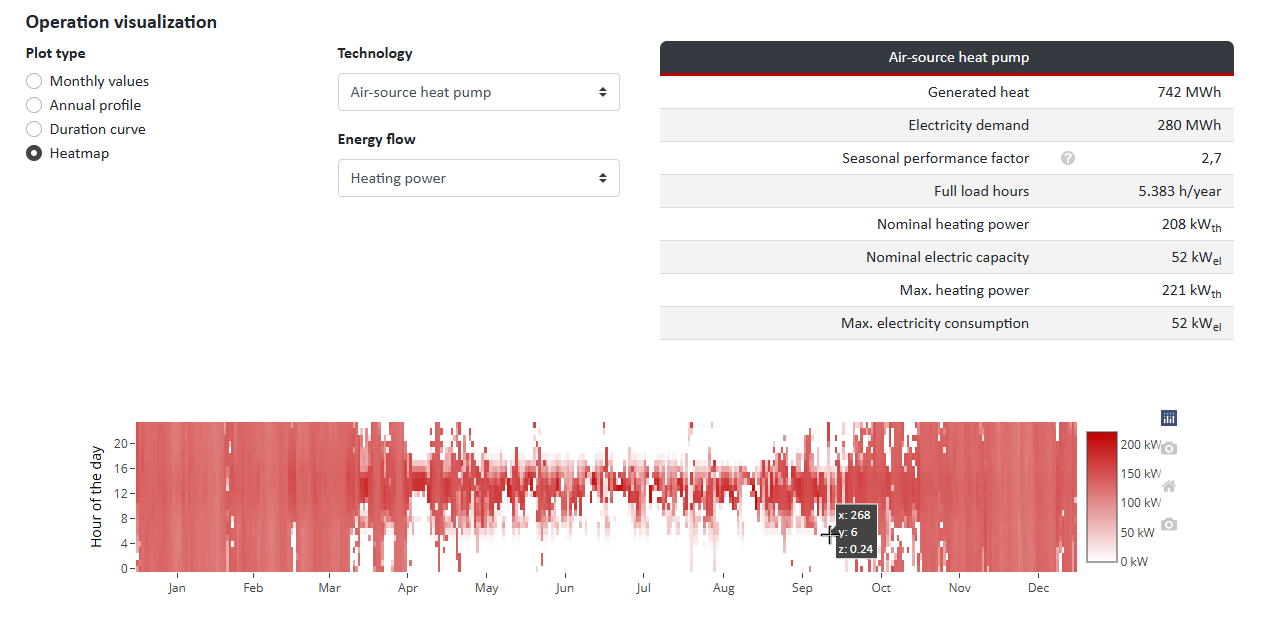
In the heatmap visualization ({filename='static/simulation-time-series-visualization-air-source-heat-pump-heatmap.png'}) it is evident that the air-source heat pump supports the natural gas boiler in winter, while it operates mainly during the day in summer when the photovoltaic system generates electricity. At night, its operation is significantly reduced.
The nPro simulation optimizes the operation of the air-source heat pump by prioritizing its use during periods of high (low-cost) PV electricity generation. This allows for the use of cheaper electricity and, due to higher outside air temperatures during the day, achieves a higher COP.
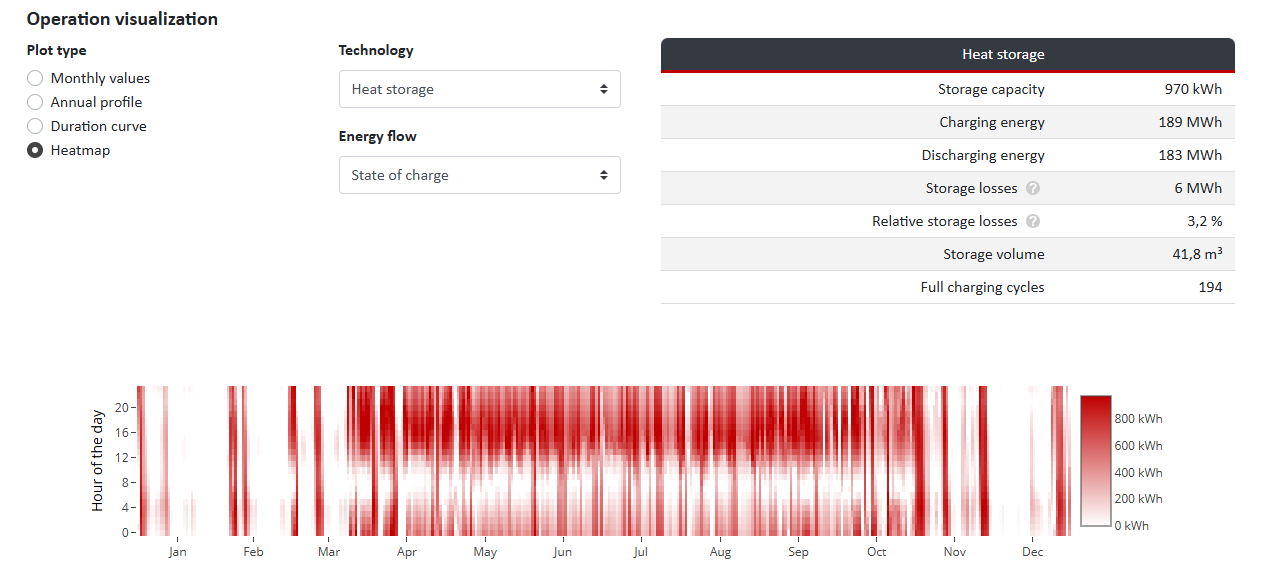
By selecting different technologies and visualizations, further insights can be gained into the interaction of energy sources and their dependence on time of day and season ({filename='static/simulation-time-series-visualization-heat-storage-heatmap.png'}).
Results Overview
The results overview provides a summary of the most important data along with graphical visualizations. Key aspects include:
- Energy Consumption:
- Electricity consumption from the grid
- Renewable electricity generation
- Natural gas
- Heat from solar thermal
- Energy Supply
- Electricity Generation and Consumption:
- Renewable electricity generation (various sources)
- Electricity consumption from the grid
- Self-sufficiency rate
- Self-consumption ratio
- Heat Generation and Consumption:
- Various technologies
- Solar thermal coverage ({filename='static/summary-heat-generation-supply-demand-solar-thermal-heat-pump.png'})
- Emissions:
- Electricity consumption
- Electricity supply
- Natural gas
- Primary Energy:
- Electricity consumption
- Electricity supply
- Natural gas
- Energy Demands:
- Electricity demand
- Heat demand
The simulation results can be exported as an hourly resolved Excel file via the button.
10) Summary & Profitability
In the left menu of nPro, after completing the operational simulation in the energy hub, the can be selected.
By clicking on , the subcategories Summary, Energy Hub, and Profitability can be accessed.
The button leads to a detailed analysis of all economic aspects ({filename='static/profitability-district-heating-annual-balance-heat-costs.png'}).
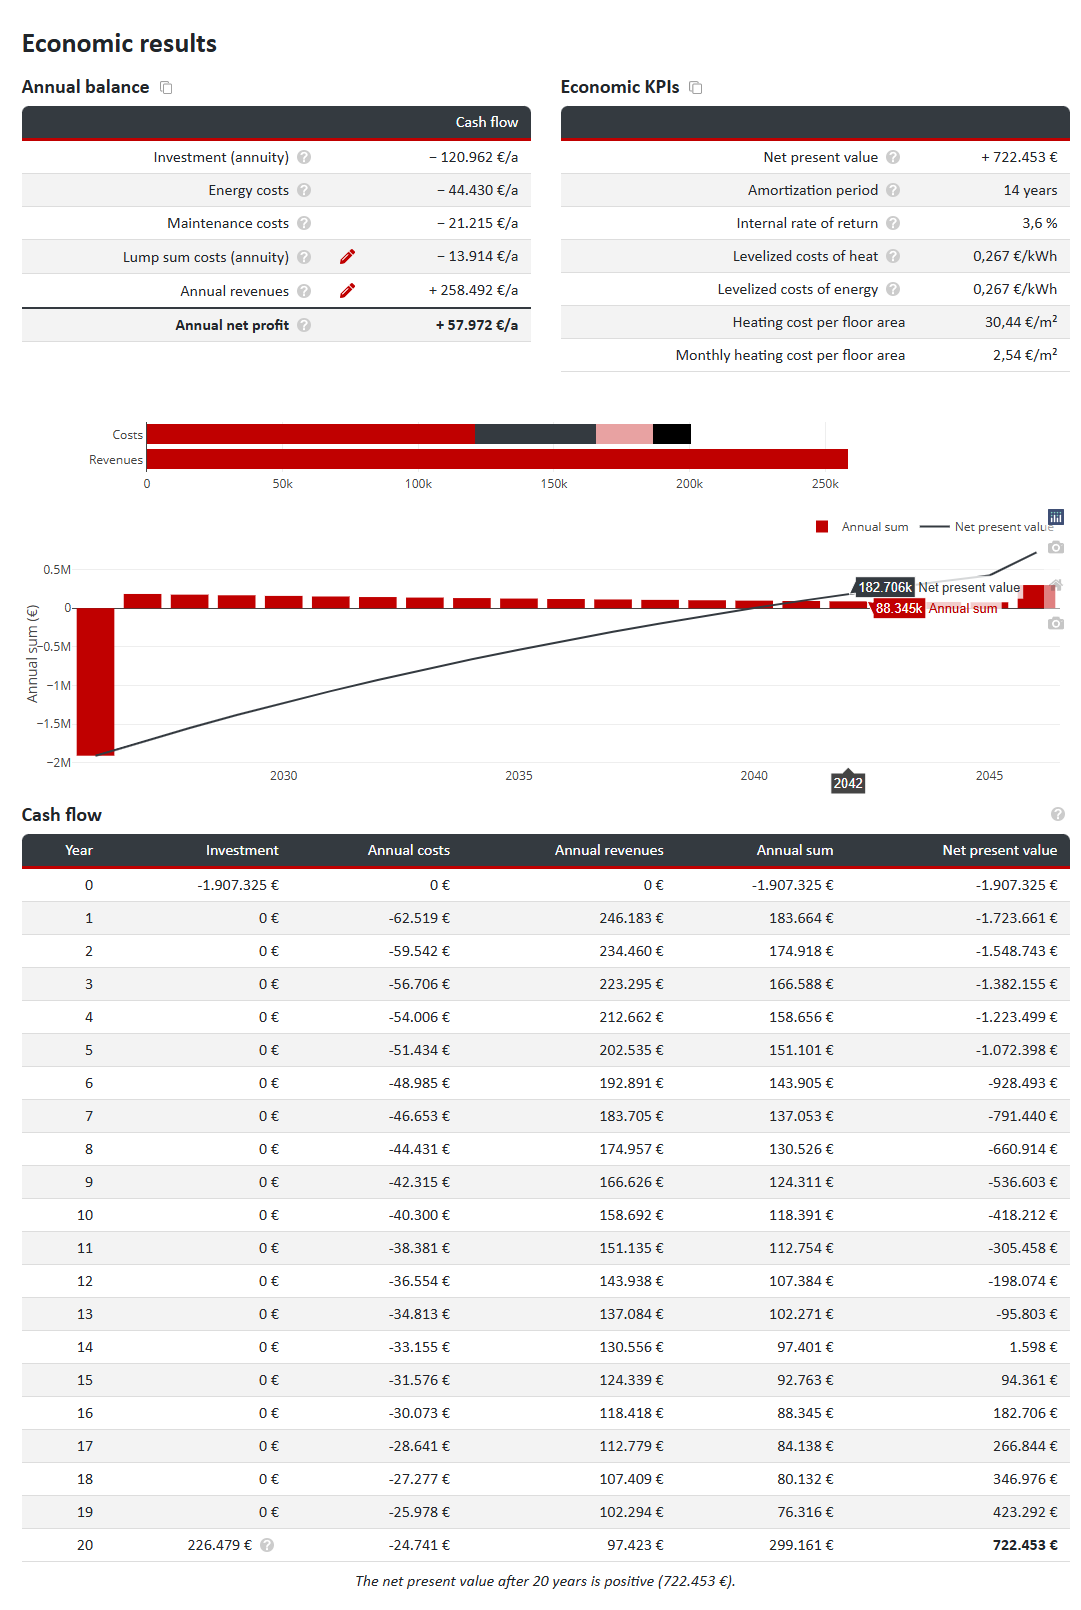
Annual Balance
Under , the yearly cash flows for various cost and revenue categories are displayed:
- Investment (annuity)
- Energy costs
- Maintenance costs
- Fixed costs (annuity)
- Annual revenues
- Annual surplus
Further adjustments are possible here. For example, under Annual Revenues, the revenues for demand coverage can be viewed, and the following values can be configured:
- Energy price
- Capacity price
- Base price
- One-time connection fee
These settings apply to heat demand, cooling demand, user electricity, e-mobility, and hydrogen.
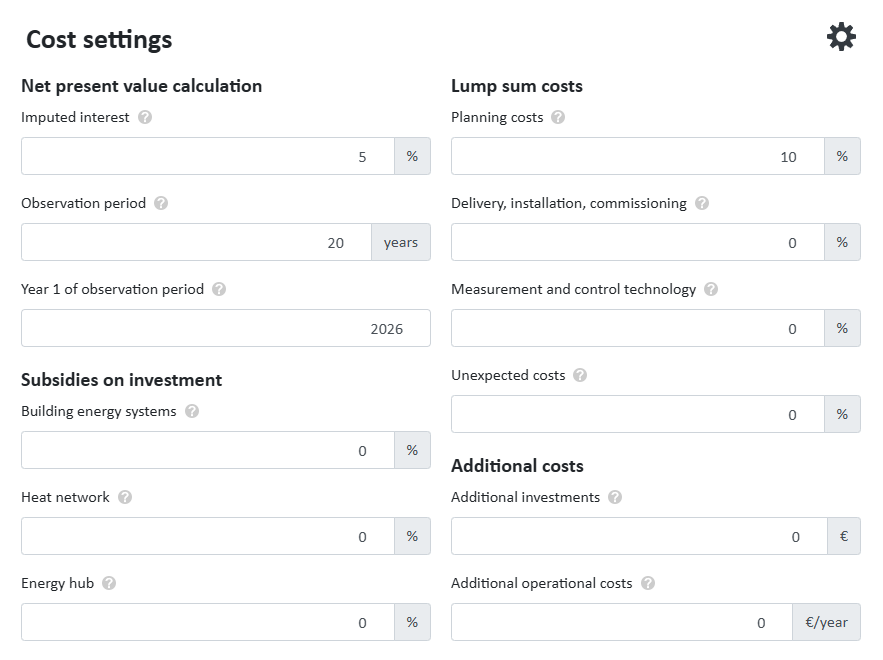
Additionally, under Fixed Costs ({filename='static/profitability-energy-costs-heat-pump-photovoltaics.png'}) further parameters can be set:
- Capital value calculation: Discount rate; analysis period (start year, duration)
- Investment subsidies (%): Building energy systems, district heating network, energy hub
- Fixed costs: Planning costs; delivery, installation, commissioning; measurement and control technology; unforeseen costs
- Other costs: Other investment costs; other operational costs
Key Figures
Under , summary economic indicators are listed:
- Capital Value
- Payback Period
- Internal Rate of Return
- Heat Generation Costs
- Heating Costs per Usable Area
- Monthly Heating Costs per Usable Area
Cost & Revenue Overview
The relevant cost categories and investments of the energy network can be viewed in detail and adjusted if necessary:
- Investments:
- Building Energy Systems
- District Heating Network ({filename='static/profitability-district-heating-annual-balance-payback-period.png'})
- Energy Hub
- Other Investments
- Energy Costs:
- Electricity
- Natural Gas
- Maintenance Costs:
- District Heating Network
- Energy Hub
- Other Operational Costs
- Fixed Costs:
- Planning Costs (Investments × Percentage = Total, Annuity)
- Annual Revenues:
- Electricity Feed-In
- Heat Demand
- Heat Demand (Capacity Price, Base Price)
Investments
The results page provides a detailed breakdown of investments. Here, the various cost items can be viewed and adjusted if necessary:
- Building Energy Systems:
- District Heating Connection
- District Heating Network
- Energy Hub: Each installed technology in the energy network, e.g.:
- Photovoltaics
- Natural Gas Boiler
- Solar Thermal
- Air Source Heat Pump
- Heat Storage
11) Scenario Comparison
On the left of the main interface, an existing scenario can be selected, copied, and renamed via .
The copy now serves as a template for one or more new scenario(s).
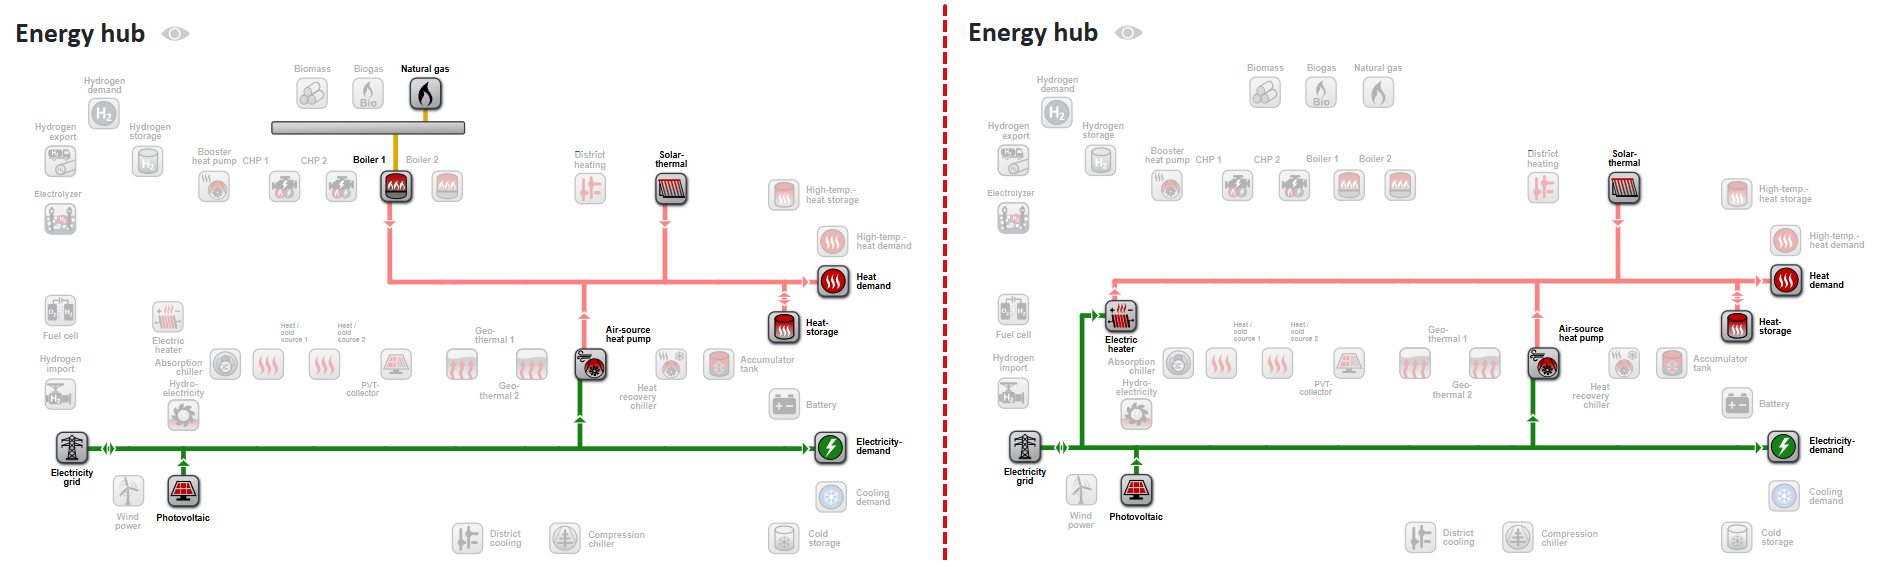
Here, two scenarios with different heating systems but otherwise identical configurations are created ({filename='static/scenarios-district-heating-gas-boiler-electric-heater-heat-pump.png'}):
- Scenario 1 - Gas Boiler + ASHP (District heating network with gas boiler & air source heat pump)
- Scenario 2 - Electric Heater + ASHP (District heating network with electric heater & air source heat pump)
Now, in one of the multiple scenarios, the can be recalculated, the systems in the dimensioned, and the operation simulated. Then, via , the section can be accessed.
Summary
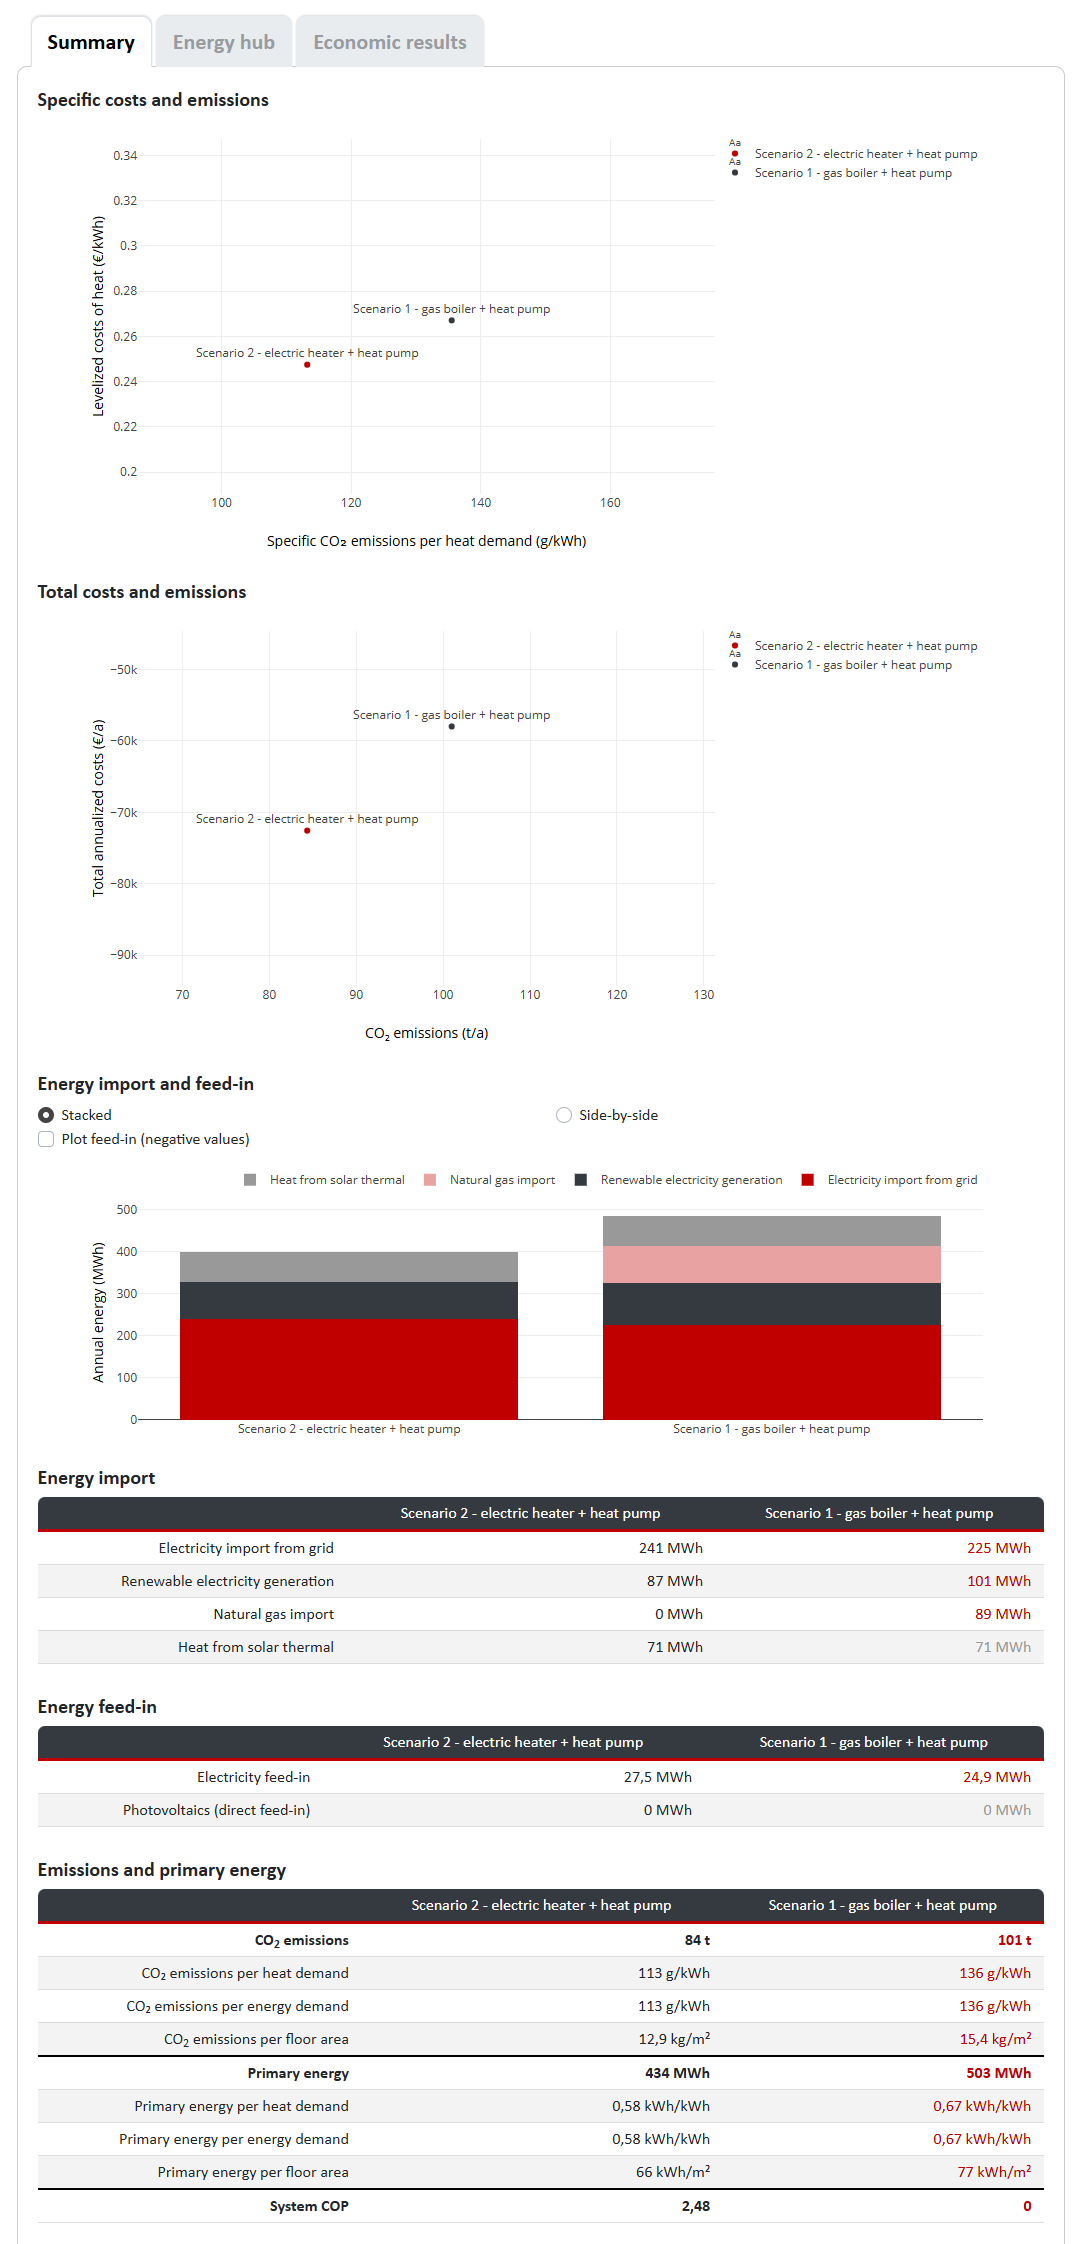
Energy Hub & Economic Efficiency
In the sections and , differences and similarities between the scenarios are displayed in tables and graphs, similar to the Summary ({filename='static/scenarios-gas-boiler-electric-heater-heat-pump-economic.png'}).
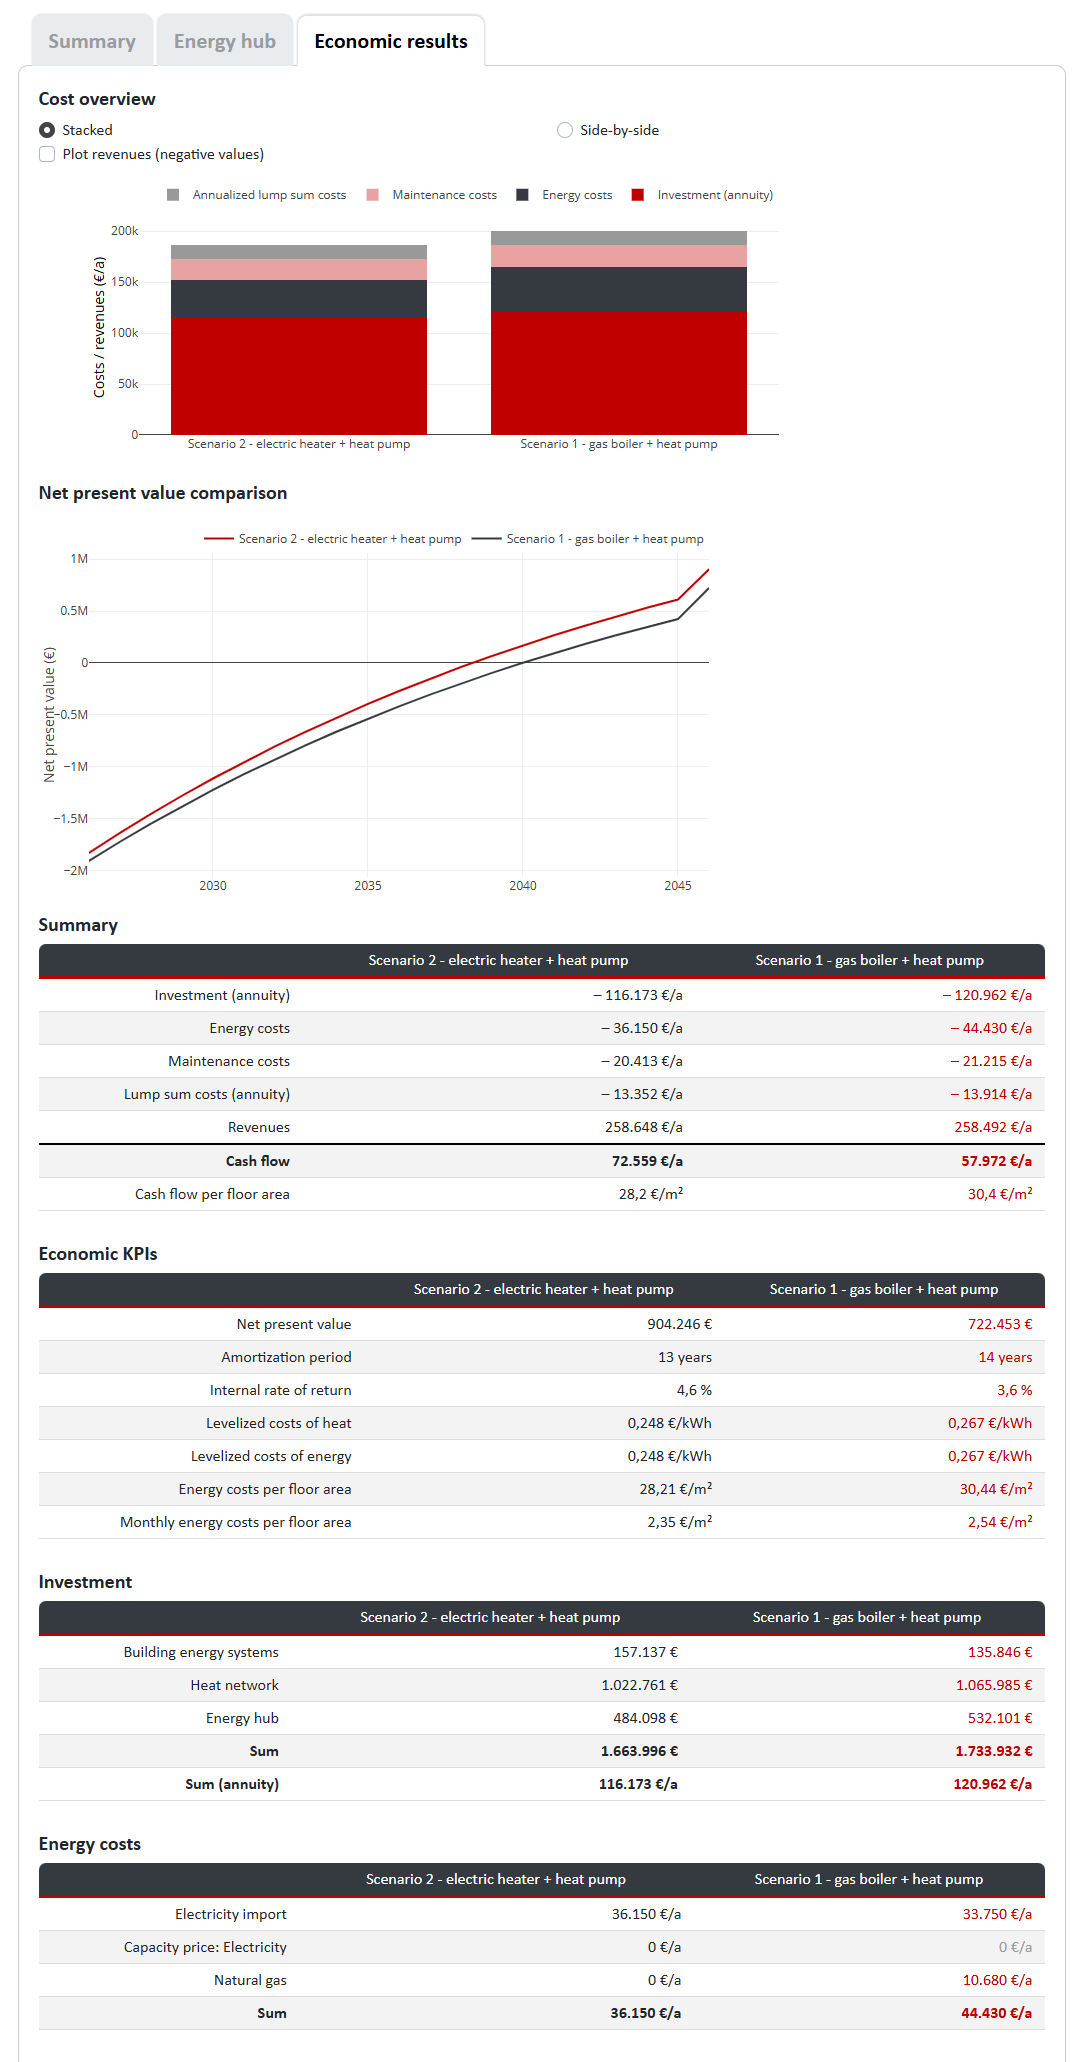
With clear and detailed summaries of technical and economic parameters, nPro simplifies the evaluation of projects.
 English
 Deutsch


