Linear heat density
The linear heat density describes the amount of heat transported by a district heating network per unit length. It is calculated for each network section and provides planners with an indicator of whether a specific network section can be operated economically and efficiently. The calculation divides the transported heat by the length of the subsequent network section (downstream), with the unit being \( \text{MWh} / (\text{m} \cdot \text{a}) \).
How is the linear heat density calculated in nPro?
In nPro, the linear heat density is calculated for every pipe in the network to assess the economic efficiency of various sections. The calculation follows this formula:
\[\text{Linear Heat Density} = \frac{\text{Transported Heat}}{\text{Total length of the network downstream}}\]
Results are displayed on a map, providing a quick overview of the efficiency and economic viability of the district heating network. Users can enable the display via "District Heating" -> "Linear Heat Density." Additionally, the linear heat density for the connection line to the energy hub is provided.
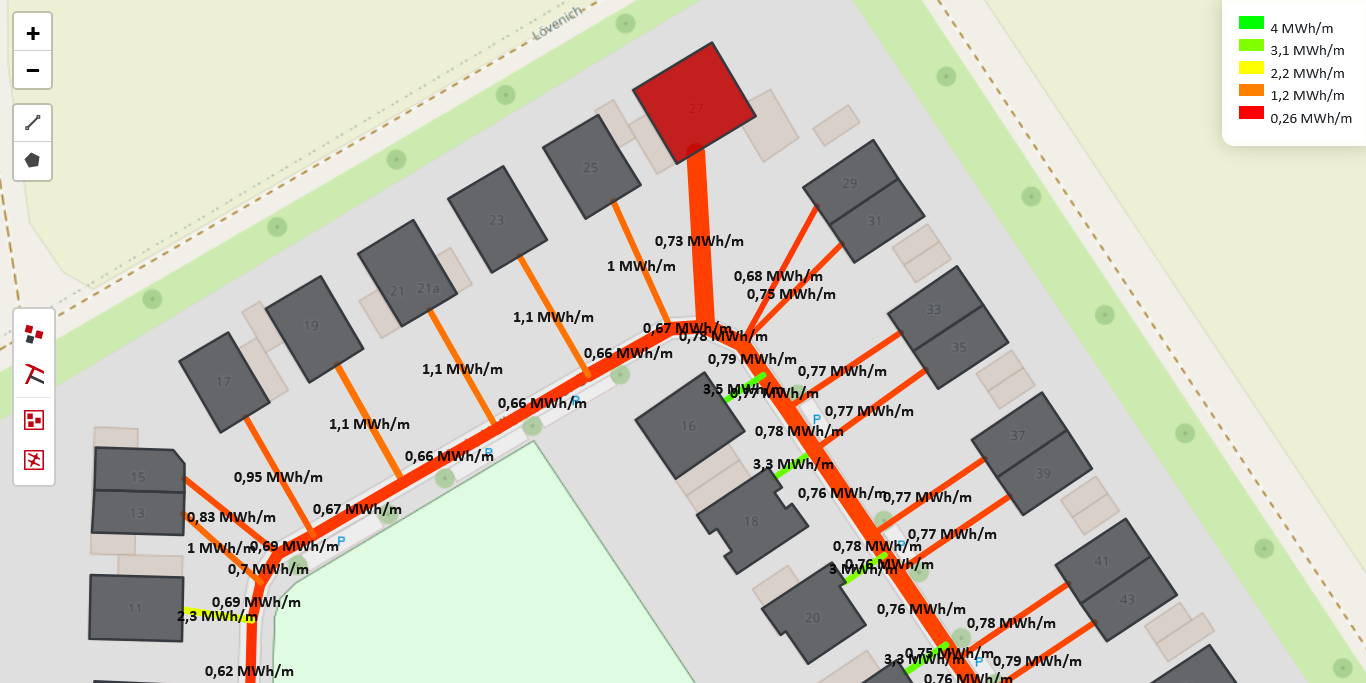
How is the linear heat density evaluated in nPro?
The evaluation is based on color coding in the map or a graphical symbol in the results. The classifications are as follows:
- Poor: Linear heat density < 0.75 \( \text{MWh} / (\text{m} \cdot \text{a}) \)
- Average: Linear heat density between 0.75 and 1.5 \( \text{MWh} / (\text{m} \cdot \text{a}) \)
- Good: Linear heat density > 1.5 \( \text{MWh} / (\text{m} \cdot \text{a}) \)
These values are valid only for conventional district heating networks and do not apply to 5GDHC networks. The threshold of 1.5 \( \text{MWh} / (\text{m} \cdot \text{a}) \) is derived from the guideline by C.A.R.M.E.N e.V. [1].
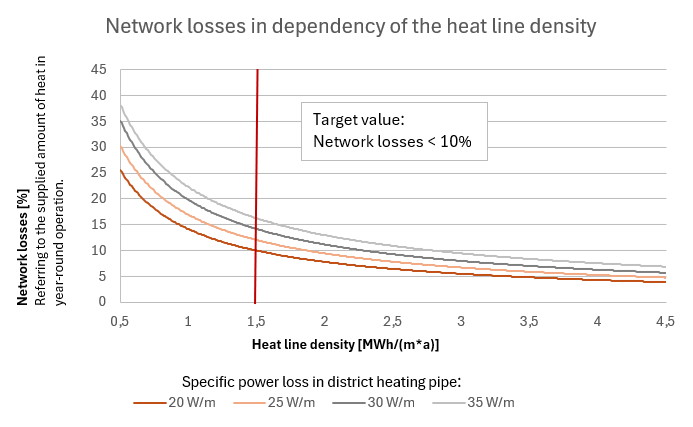
Achieving a high linear heat density minimizes network losses and reduces investment costs per transported heat unit, thereby increasing economic efficiency. The goal is to keep network losses below 10%.
 English
 Deutsch


